---
title: "Gantt"
slug: "gantt"
abstract: "Use the Gantt page component to display a project timeline, task distribution, and progress."
---
# Gantt
Using a **Gantt** page component, you can incorporate a Gantt chart into your details pages and visualize the scope and timeline for a project. This provides a clear view of the project schedule, task distribution, and progress.
> [!note]
> The **Gantt** page component is only supported on [React pages](https://doc.sitecore.com/ch/en/developers/cloud-dev/migrating-to-react.html). You can configure a Gantt chart for any definition that is related to the page entity. A Gantt chart can display up to 500 rows across a maximum of five levels.
The following table shows standard use cases with the general settings.
| Type | Details page | Page definition | Definition | Relation to page entity | Linked items |
| --- | --- | --- | --- | --- | --- |
| Project | Project / Block (item) details page | `M.Project.Block` | `Block` | `BlockToSelf` | Block items
Relation: `BlockToSelfPredecessors` |
| Campaign | Campaign / Campaign detail | `M.CMP.Campaign` | `ContentCampaignDetail` | `CampaignToContent` | Relation: `ContentToContentAdaption-Parent` |
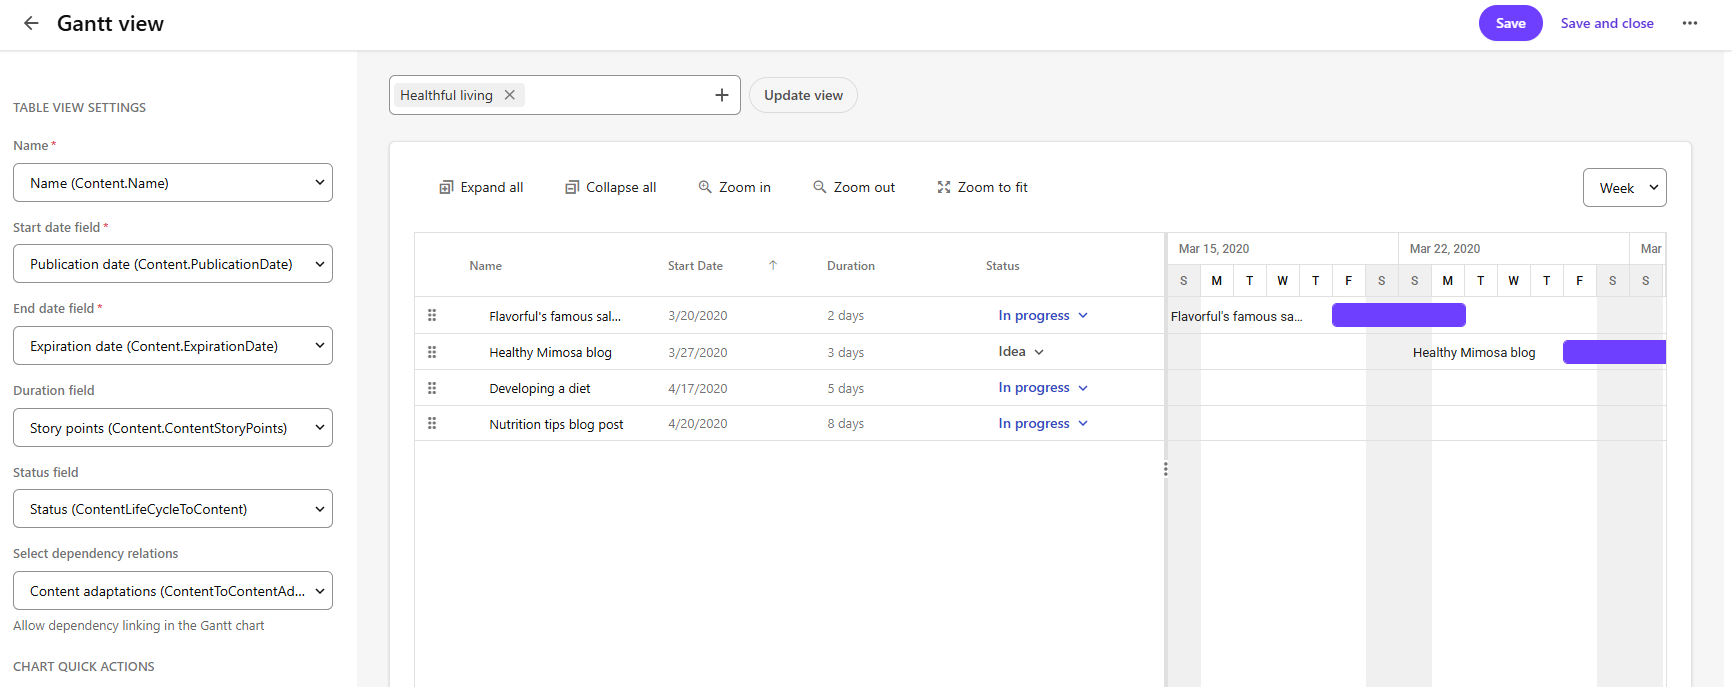
After you define the Gantt settings and click **Update view**, you can see a Gantt chart.
To add a Gantt page component:
1. On the menu bar, click **Manage** :mdiCogOutline:.
2. On the **Manage** page, click **Pages**.
3. On the **Pages** page, select the details page that you want to modify.
4. On the **Layout** tab, [add the page component](https://doc.sitecore.com/ch/en/users/content-hub/add,-modify,-or-delete-page-components.md "Add, modify, or delete page components").
5. Click the component to open its details page.
6. In the left pane, in the **MAIN SETTINGS** section, define the following settings:
| Setting | Description |
| --- | --- |
| **Display Gantt chart for** | Lists definitions that are related to the page definition. Select the definition for which you want to display a Gantt chart, for example, **The same as details page (M.Project.Block)**. |
| **Gantt chart relation** | Displays possible relations, such as relation links or self items, for example, **Items (BlockToSelf - Parent)**. |
7. In the left pane, in the **TABLE VIEW SETTINGS** section, define the following settings.
| Setting | Description |
| --- | --- |
| **Name** | Determines the name displayed in each row, for example, **Name (BlockName)**. |
| **Start date field** | Indicates the field used for the start date of each item in the Gantt chart, for example, **Start (CalculatedStartDate)**. |
| **End date field** | Indicates the field used for the end date of each item in the view, for example, **End (CalculatedStopDate)**. |
| **Duration** | Indicates the duration of each item in the Gantt chart. This is optional because it's derived from `enddate-startdate`. |
| **Status field** | The status of each field in the Gantt chart, for example, **Status (BlockLifecycleStatusToBlock)**. |
| **Select dependency relations** | The relation dependencies (self relations) that you want displayed in the Gantt chart, for example, **Assets (BlockToSelfPredecessors)**. |
8. In the **CHART QUICK ACTIONS** section, click an action to select a details page to use when creating the new item or for the quick edit. Quick actions are added to each row.
9. In the **CHART ROOT ACTIONS** section, click an action to add a milestone or stage. Chart root actions are added at the top of the Gantt chart.
10. To preview the Gantt chart, above the chart preview area, select an entity to preview, and click **Update view**.
11. In the duration drop-down list, select the time period of the Gantt chart. You can use the buttons above the chart to expand and collapse records, to zoom in or out, or zoom to fit.
12. Click **Save and close**.