---
title: "Data feed reports"
slug: "data-feed-reports"
abstract: "Shows where in the Customer Engagement Console you can monitor the status of data feed runs in Sitecore Discover."
---
# Data feed reports
In the Customer Engagement Console (CEC), Sitecore Discover provides reports that let you quickly see the status of your data feed runs. In these reports you can drill down to see more details about specific data feed runs, providing deep insights into the overall health and status of your scheduled data feed processes.
Discover provides analytics about product, category, and offline sales data feed runs.
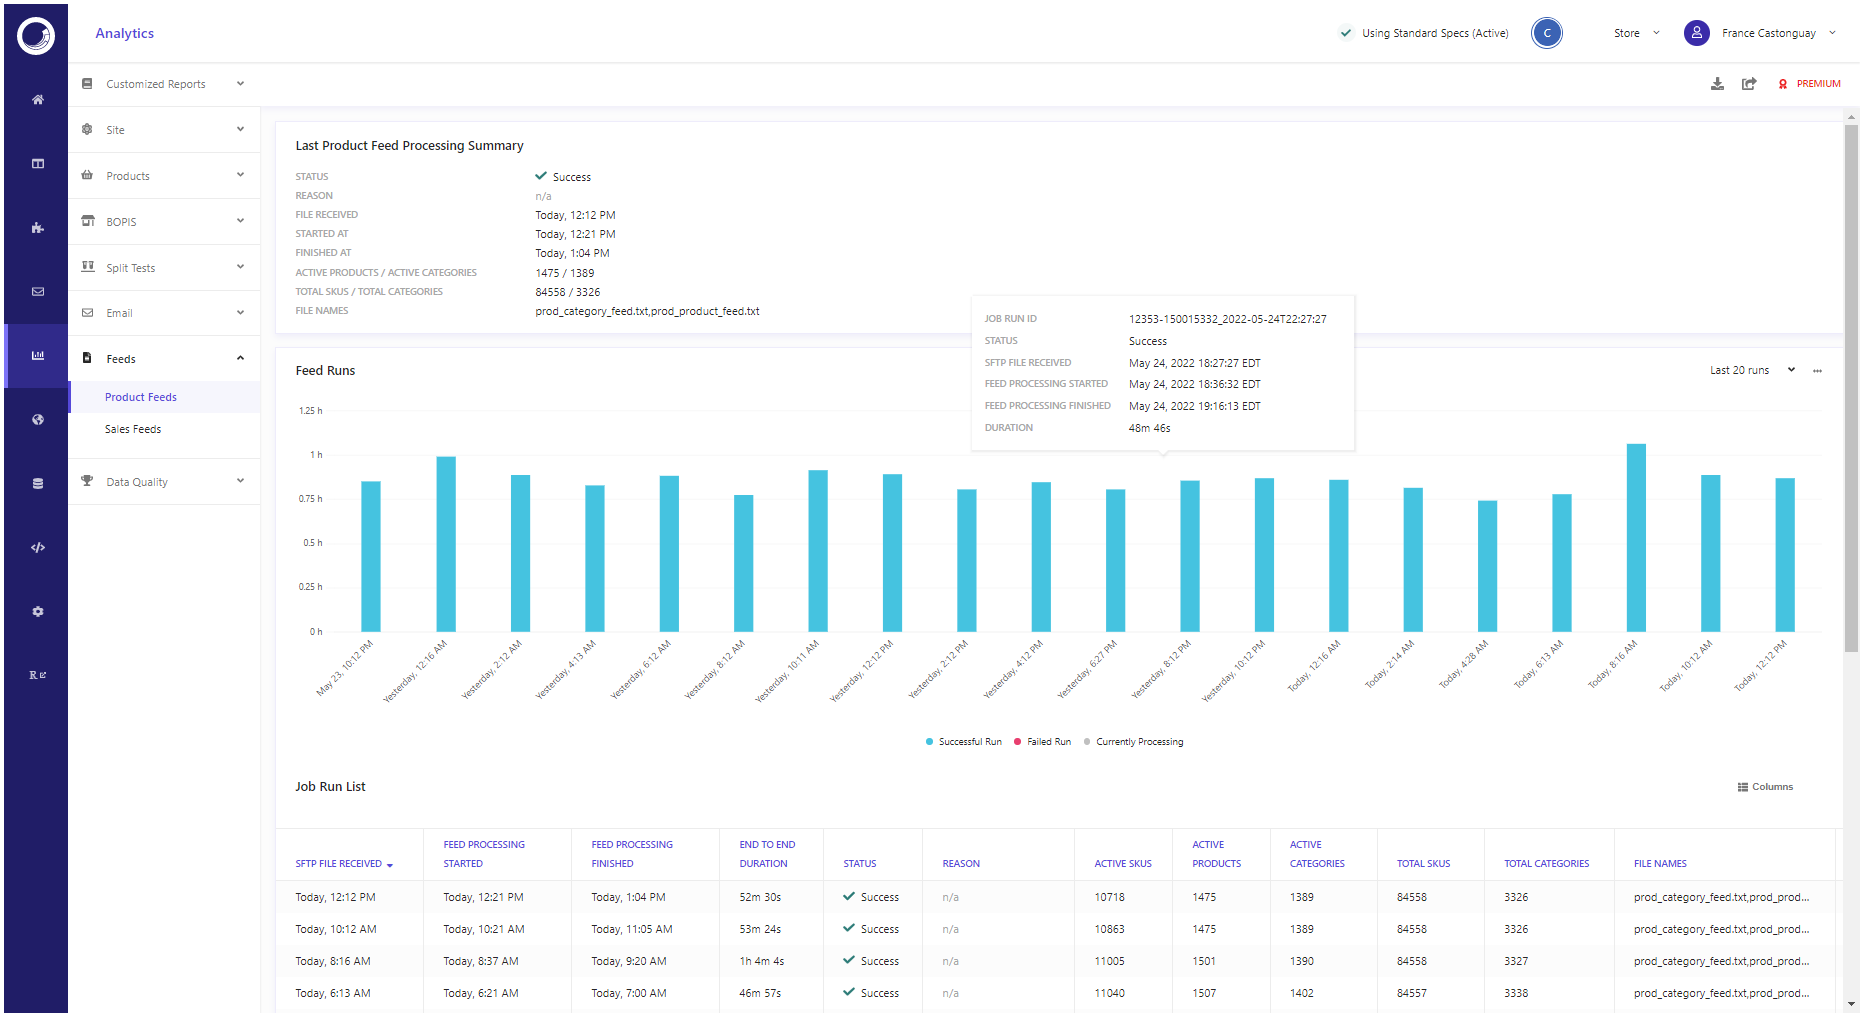
Following is an example of the *Product feeds* report in the CEC.
> [!note]
> The analytics provided for products and sales data feeds are very similar. The following information applies to products and sales data feed reports. Differences are highlighted where they exist.
The *Product feeds* report is divided into the following sections:
- [The last feed process summary reports](https://doc.sitecore.com/discover/en/users/discover-user-guide/monitor-performance/data-feed-reports.html#UUID-9fabd6ec-0b26-536e-698d-f0a367974cec_section-idm4517954464390433070187349968 "The last feed process summary reports")
- [The feed runs timeline report](https://doc.sitecore.com/discover/en/users/discover-user-guide/monitor-performance/data-feed-reports.html#UUID-9fabd6ec-0b26-536e-698d-f0a367974cec_section-idm4517954179443233070260795358 "The feed runs timeline report")
- [The job run list report](https://doc.sitecore.com/discover/en/users/discover-user-guide/monitor-performance/data-feed-reports.html#UUID-9fabd6ec-0b26-536e-698d-f0a367974cec_section-idm4583428549192033071428425202 "The job run list report")
The last feed process summary reports
Discover provides a distinct last feed process summary reports for product data feed and for the sales data feed.
The *Last product feed process summary* and the *Last sales feed process summary* reports provide similar information about the overall status of the last data feed run.
The following table lists items provided in the last feed process summary reports for both the products and sales data feed:
| Summary item | Description | Product feed | Offline sales feed |
| --- | --- | --- | --- |
| STATUS | Whether or not the last feed to run was successful. | Yes | Yes |
| REASON | Probable cause of failure when the feed failed. | Yes | No |
| FILE RECEIVED | Time the data feed file was uploaded to the FTP site. | Yes | Yes |
| STARTED AT | Time when the feed processing started. | Yes | Yes |
| FINISHED AT | Time when the feed processing ended. | Yes | Yes |
| ACTIVE PRODUCTS / ACTIVE CATEGORIES | Number of active products and active categories included in the data feed run. | Yes | No |
| TOTAL SKUS / TOTAL CATEGORIES | Total number SKUS and categories in the data feed run. | Yes | No |
| FILE NAMES | Names of the product and category data feed files. | Yes | Yes |
| LINES PROCESSED | Number of lines processed in feed. | No | Yes |
| FILTERED OUT RECORDS | Number of records filtered out by feed process. | No | Yes |
| VALID RECORDS | Number of valid records. | No | Yes |
| ORDER EVENTS | Number of order events processed. | No | Yes |
| VIEW EVENTS | Number of view events processed. | No | Yes |
| SKU RESOLUTION ERRORS | Product or SKU errors. | No | Yes |
The feed runs timeline report
The *Feed runs* timeline report provides a visual overview of the status of the last 20, 30, or 50 data feed runs. The bar chart is color coded where:
- Blue bars indicate a successful run.
- Pink bars indicate a failed run.
- Gray bars indicate currently a run currently process.
From each bar or date in the chart, you can drill down to a more [detailed report about a specific data feed run ID](https://doc.sitecore.com/discover/en/users/discover-user-guide/monitor-performance/data-feed-reports.html#UUID-9fabd6ec-0b26-536e-698d-f0a367974cec_section-idm4500422300993633070271614088 "Detailed report by Job Run ID").
The job run list report
The *Job run list* report provides an overview of the last 20, 30 or 50 job runs in a table format (same feed runs as those displayed in the bar chart).
The table consolidates information provided in the **[Last product feed process summary](https://doc.sitecore.com/discover/en/users/discover-user-guide/monitor-performance/data-feed-reports.html#UUID-9fabd6ec-0b26-536e-698d-f0a367974cec_section-idm4517954464390433070187349968 "The last feed process summary reports")** report with the following additional data:
| Job run list item | Description |
| --- | --- |
| END TO END DURATION | Total duration of feed run. |
| ACTIVE SKUS | Number of active SKUs in feed run. |
| ACTIVE CATEGORIES | Number of active categories in feed run. |
From each row in the Job Run List table, you can drill down to a more [detailed report about that specific data feed run](https://doc.sitecore.com/discover/en/users/discover-user-guide/monitor-performance/data-feed-reports.html#UUID-9fabd6ec-0b26-536e-698d-f0a367974cec_section-idm4500422300993633070271614088 "Detailed report by Job Run ID").
Detailed report by Job Run ID
In addition to the product feed process summary information, the detailed report by job run ID provides the following:
### Run details timeline
The *Run details* report provides a timeline that includes:
| Run details items | Description |
| --- | --- |
| SFTP File Received | Date and time the SFTP file for that run was received. |
| Feed Processing Started | Date and time the data feed processing started. |
| Feed Processing Finished | Date and time the data feed processing ended. |
### Feed files
The *Feed files* table provides the following overview information about each data feed file included in a job:
| Column | Description |
| --- | --- |
| FILE NAME | The name of the feed file that is part of the run job. |
| TAG | Tag that identifies category or product data. |
| TIMESTAMP | The time stamps of the feed file. |
| SIZE | The size of the file. |
| LINES PROCESSING | The number of lines processed. |
| LINES DROPPED | The number of lines dropped. |
The *Feed files* table lets you drill down further to view the *Feed file details* report.
The *Feed file details* report provides a detailed visual of product attributes and values included in the product feed.
> [!note]
> The content of the product feed file details report is specific to each product catalog implementation.
### Breakdown of dropped lines
The *Breakdown of dropped lines* report provides a summary of data feed files from which lines were dropped during the data feed process.
The summary includes: the file name, the reason for dropping ine, and the number of lines dropped. The *Breakdown of dropped lines* report lets you can drill down further to view the *Breakdown of dropped line details* report.
The *Breakdown of dropped line details* report contains detailed information about each dropped dropped line, including: line number, file name, error field, reason, and the content of the dropped line.
### Feed task details
The *Feed task details* table provides the status information about the following tasks that take place during the data feed process, including:
- `data_sync`
- `feed_post_processing`
- `indexing`