---
title: "Request errors comparative metrics"
slug: "request-errors-comparative-metrics"
abstract: "Request errors report comparing metrics in the analytics section of Sitecore Discover Customer Engagement Console (CEC)."
---
# Request errors comparative metrics
the *Request errors comparative metrics* report uses various properties and metrics to report on request errors.
A comparative metrics report has two parts, *Metrics tiles* and *Metrics comparison over a date range*.
Metrics tiles
This is the first part of a comparative metrics report. It displays a tile for every relevant metric and KPI. Each tile reports the overall value for the selected period. The following is a generic example of metric tiles.
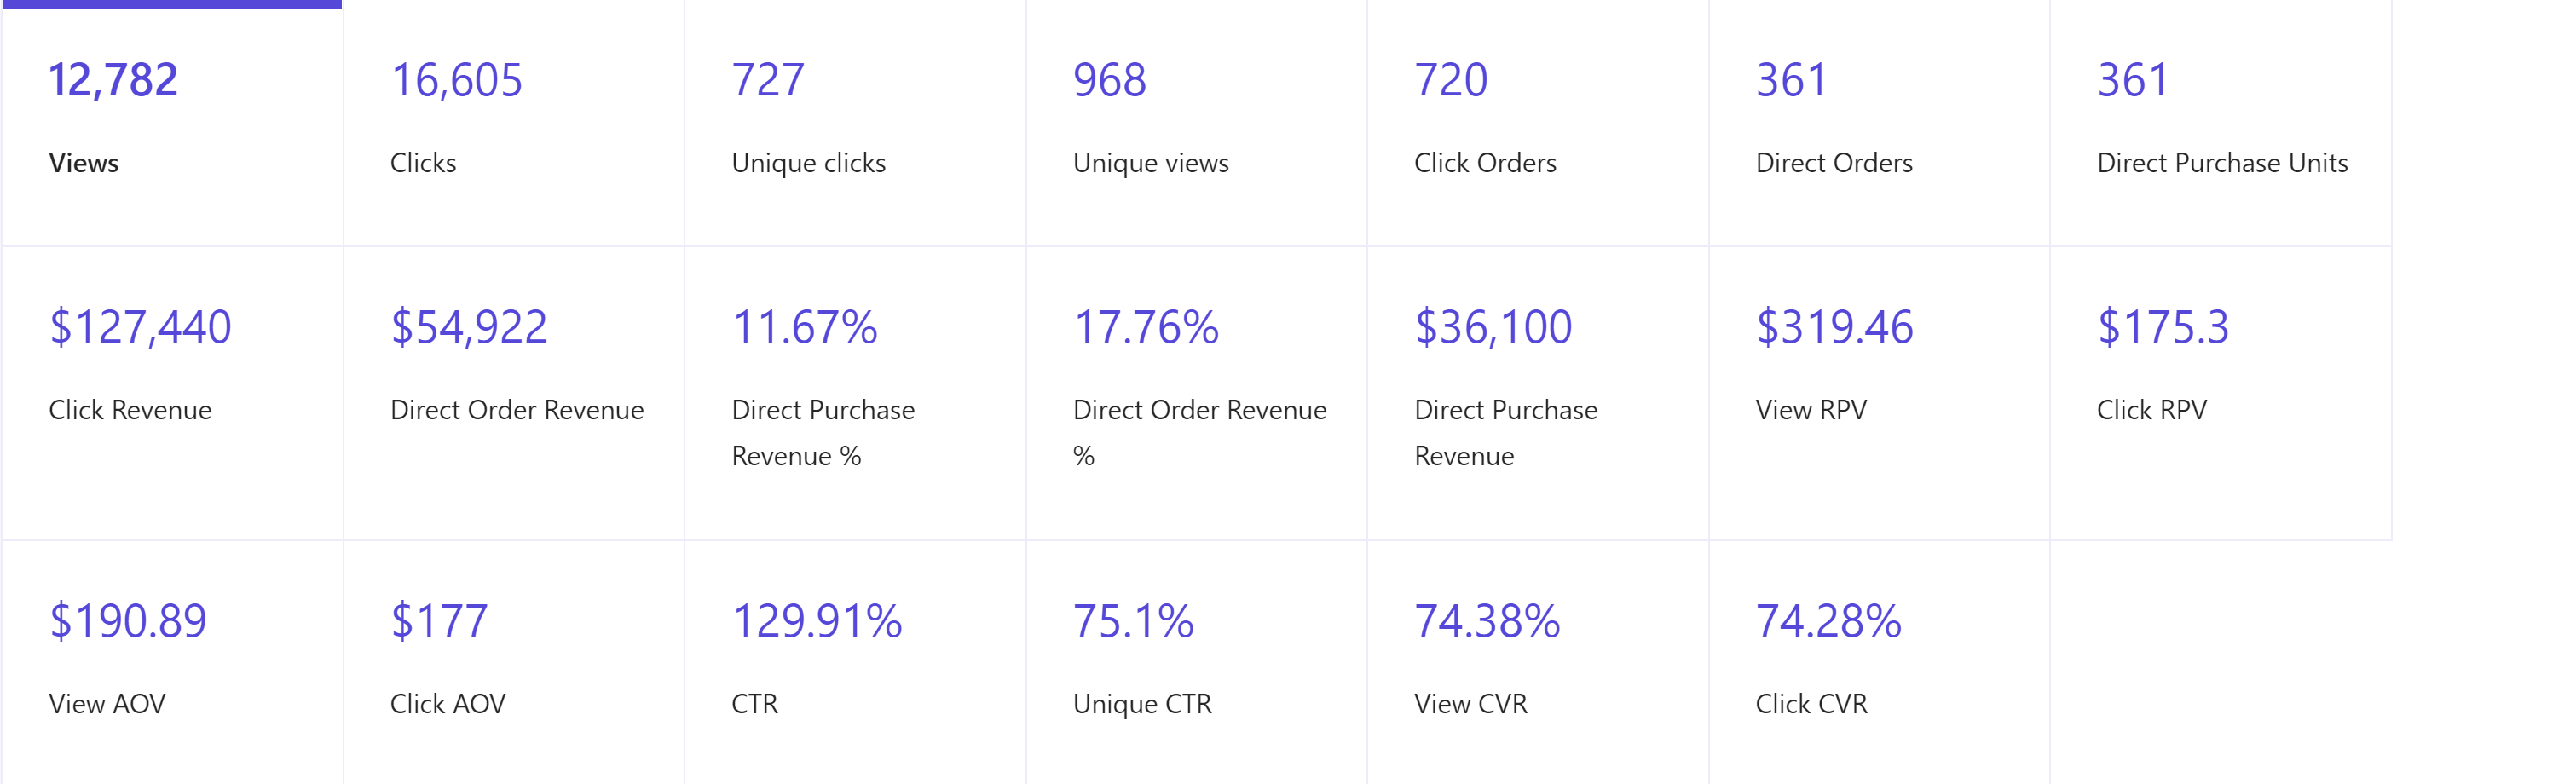
Clicking a metric tile sets its metric as the first metric in the second part of this report, the *Metrics comparison over the date range* part.
Metrics comparison over a date range
This is the second part of a comparative metrics report. It is a line chart comparing two performance metrics over a selected period. You can select metrics from two drop-down menus.
The following is a generic screenshot of comparative line charts for two metrics.
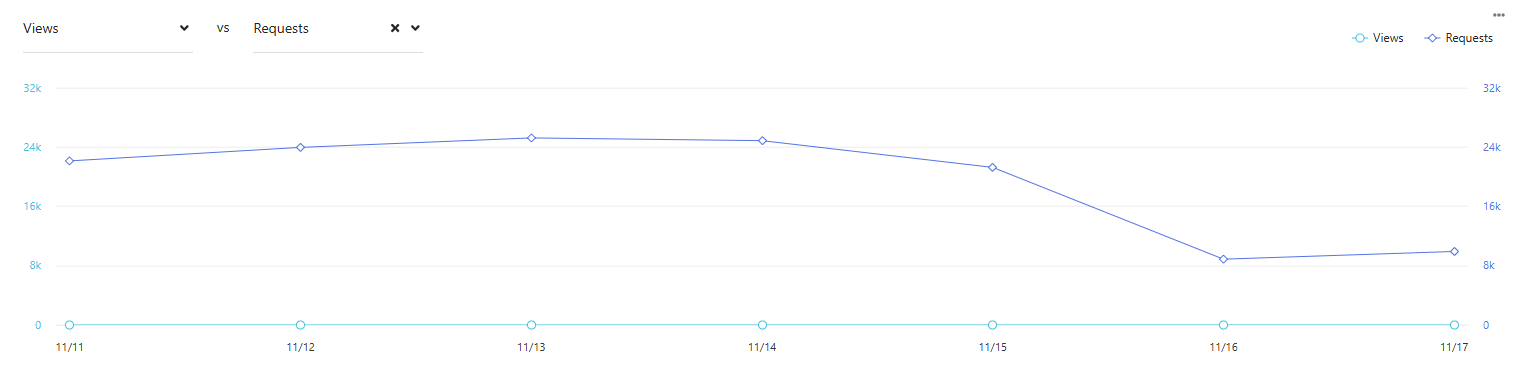
You can also set the first metric by clicking a metric tile in *Metric tiles*, the first part of this report.
To examine data points in charts and tables, hover your mouse over the point or element.
To export data, click ![Additional options]() and then click **Export Data**.
Data filters
Use the following filters to generate data for this report:
**Date range** - includes *Yesterday*, *Last 7 days*, *Last 14 days*, *Last 30 days*, *Last 90 days*, and *Customized range*.
**Devices** - includes *Desktop*, *Tablet*, *Mobile*, and *Bot*.
**Issue type** - includes *Field value is missing* and other issue types.
**IDs** - includes *All Discover IDs* and other IDs.
**Field** - includes all available fields. Default is *All fields*.
**Severity** - includes *All severity* and *High*.
Metrics and KPIs
This report uses the following metrics and properties:
**Total issues** - the total number of issues encountered.
**Field is missing** - the total number of cases where a field is missing in a data feed.
**Error retrieving container** - the total number of errors encountered while retrieving data container.
**Error retrieving widget ID** - the total number of errors encountered while retrieving data for widgets by ID.
**ID not found** - the total number of errors where a widget ID was not found.
**URI not found** - the total number of errors where a requested URI was not found.