---
title: "View performance analytics in Sitecore Personalize"
slug: "view-performance-analytics-in-sitecore-personalize"
abstract: "Provides details on the winning variant in an experiment."
---
# View performance analytics in Sitecore Personalize
When your experiment has been live for 24 hours, you can start viewing how the variants are performing against each other on the **Performance** screen. For the data to populate the dashboard, you must perform the following:
- Add a goal to the experiment - you must assign a primary goal to the experiment. This determines the metric that Sitecore Personalize uses to choose the winning variant.
- Start the experiment - after you start an experiment, personalization is in effect and any variants can potentially be shown to guests. You can view how the variants are performing against each other within 24 hours, and see how the assigned goals are being met.
> [!note]
> Additionally, when the experiment is live, you can immediately see its [operational data](https://doc.sitecore.com/personalize/en/users/sitecore-personalize/introduction-to-experiments-in-sitecore-personalize/view-operational-data-for-an-experiment-in-sitecore-personalize.html "View operational data for an experiment in Sitecore Personalize").
>
> For web and interactive experiments, you can also view the [A/B Test Analysis report](https://doc.sitecore.com/personalize/en/users/sitecore-personalize/introduction-to-experiments-in-sitecore-personalize/a-b-test-analysis-dashboard.html "A/B Test Analysis dashboard") for exploring test metrics such as average session duration, views, and searches.
To view performance analytics:
1. On the navigation menu, click **Experiments**. The [experiment](https://doc.sitecore.com/personalize/en/users/sitecore-personalize/introduction-to-experiments-in-sitecore-personalize/using-the-experiment-list.html "Using the experiment list") list displays.
2. To view experiments by status, click the **Live**, **Paused**, or **Completed** tab. To refine the list further, click **Web**, **Interactive**, or **Triggered** to display experiments by type.
3. Click the name of the experiment you want to view. The **Performance** screen displays.
Here's a partial image that shows the top of the **Performance** screen:

This table contains a description of each screen item on the top of the **Performance** screen:
| Screen item | Description |
| --- | --- |
| **Name** | The proper name of the experiment you're viewing. |
| **Status** and **Last updated** details | The [current status of the experiment](https://doc.sitecore.com/personalize/en/users/sitecore-personalize/introduction-to-experiments-in-sitecore-personalize/managing-experiment-status-in-sitecore-personalize.html), and the date, timestamp, and user who last updated the experiment. The current status affects the **Status** change button, as detailed in the row below. |
| **Start** or **Pause** button | If the experiment has a live status, a **Pause** button displays. If the experiment has a draft or paused status, a **Start** button displays. |
| **Preview** or **Test** button | Click **Preview** to test and [preview a web experiment](https://doc.sitecore.com/personalize/en/users/sitecore-personalize/introduction-to-experiments-in-sitecore-personalize/preview-a-web-experiment.html). To [test the API request](https://doc.sitecore.com/personalize/en/users/sitecore-personalize/introduction-to-experiments-in-sitecore-personalize/test-the-api-request-for-a-web-experiment.html) for a web experiment, click **Preview API**.
To [test and configure the API response](https://doc.sitecore.com/personalize/en/users/sitecore-personalize/introduction-to-experiments-in-sitecore-personalize/test-the-api-response-for-an-interactive-experiment.html) for an interactive experiment, click **Test**. The **Test** button only displays for interactive experiments. |
| **Vertical ellipsis** | Click to duplicate, delete, or view the history of the experiment. |
| **Status** and **schedule** banner | The status of the experiment and duration it's scheduled to run. |
| **Performance** | The **Performance** screen is selected by default when you open an experiment with a live status. |
| **Operational data** | Click to view operational metrics for the experiment. |
| **Summary** | Click to [view details of the experiment](https://doc.sitecore.com/personalize/en/users/sitecore-personalize/introduction-to-experiments-in-sitecore-personalize/duplicate,-delete,-and-view-experiment-details.html) including when it was created and who created it. |
| **Analyze & Export** | Click to [see an in-depth, day-by-day analysis](https://doc.sitecore.com/personalize/en/users/sitecore-personalize/introduction-to-experiments-in-sitecore-personalize/the-analyze-and-export-dashboard.html) of variant performance that you can download. |
| **Add dashboards** | Click to [view various analytics dashboards](https://doc.sitecore.com/personalize/en/users/sitecore-personalize/introduction-to-experiments-in-sitecore-personalize/view-dashboards.html) to better understand performance. This option is available to customers who have Sitecore CDP in addition to Sitecore Personalize. |
Here's a partial image of the middle part of the **Performance** screen:
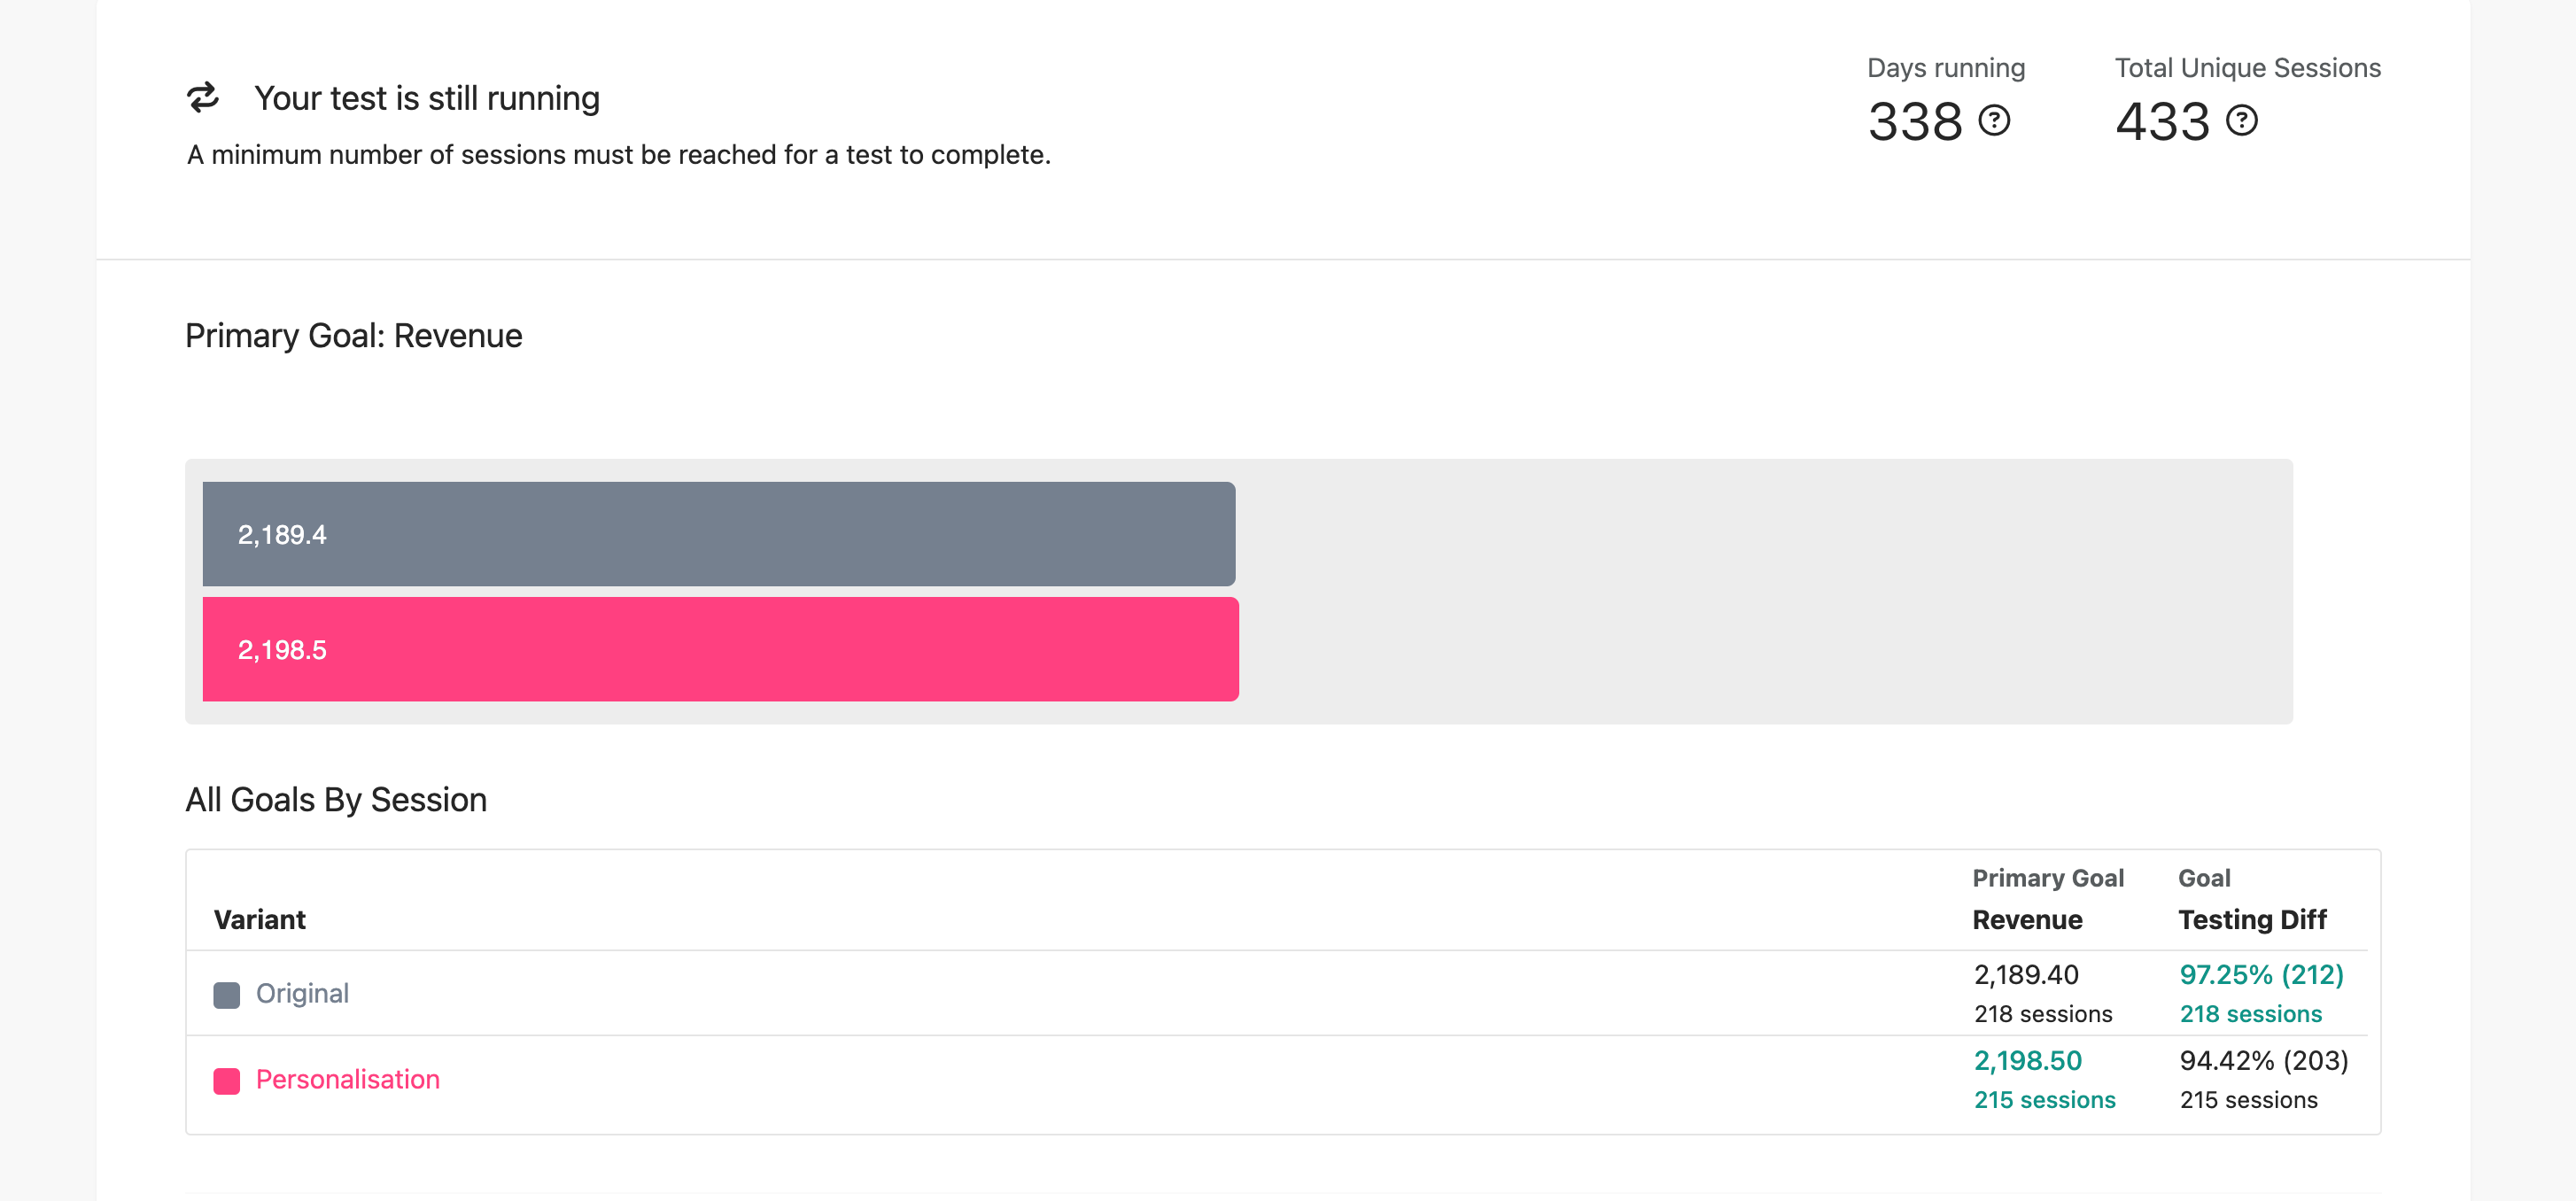
This table contains a description of each screen item on the middle part of the **Performance** screen:
| Screen item | Description |
| --- | --- |
| **Winner**, **Test is Running**, or **Completed** status banner | Displays whether the experiment has a winner variant, is completed, or is still running. If the test has a winner, it displays the name of the winning variant. The experiment must have reached statistical significance for a winner to be declared. The winning variant is measured against the primary goal. |
| **Days running** | The number of days the experiment has been running since it started. If you pause and restart the experiment, this number resets. |
| **Total Unique Sessions** | The number of current unique sessions in respect to the primary goal. |
| **Primary Goal** bar chart | Displays the performance metric of each variant against the selected primary goal—the main metric used to evaluate the experiment variants.
When you hover your mouse over a bar, a tooltip shows the error range, representing a 95% confidence level due to sampling noise.
The error range is displayed as (`goalValue` - `standardError`) — (`goalValue` + `standardError`), where `standardError` is calculated as follows:
- For binary goals (ex. conversion rate):
`standardError` = squareRootOf((`goalValue` * (1 - `goalValue`)) / sessions) - For continuous goals (ex. total revenue):
`standardError` = `standardDeviation` /squareRootOf(`numberOfDataPoints`)
where `standardDeviation` is the standard sample deviation of daily metric values, and the `numberOfDataPoints` is the count of daily records used.
|
| **All Goals By Session** table | View the performance of each variant across all goals, along with the number of sessions associated with each result.
Each goal column displays both the metric value and the total number of sessions that value is based on.
> [!note]
> The Analyze and Export tables show *distinct sessions*, which can result in lower session counts compared to the totals shown in this table. |
Here's a partial image of the lower part of the **Performance** screen:
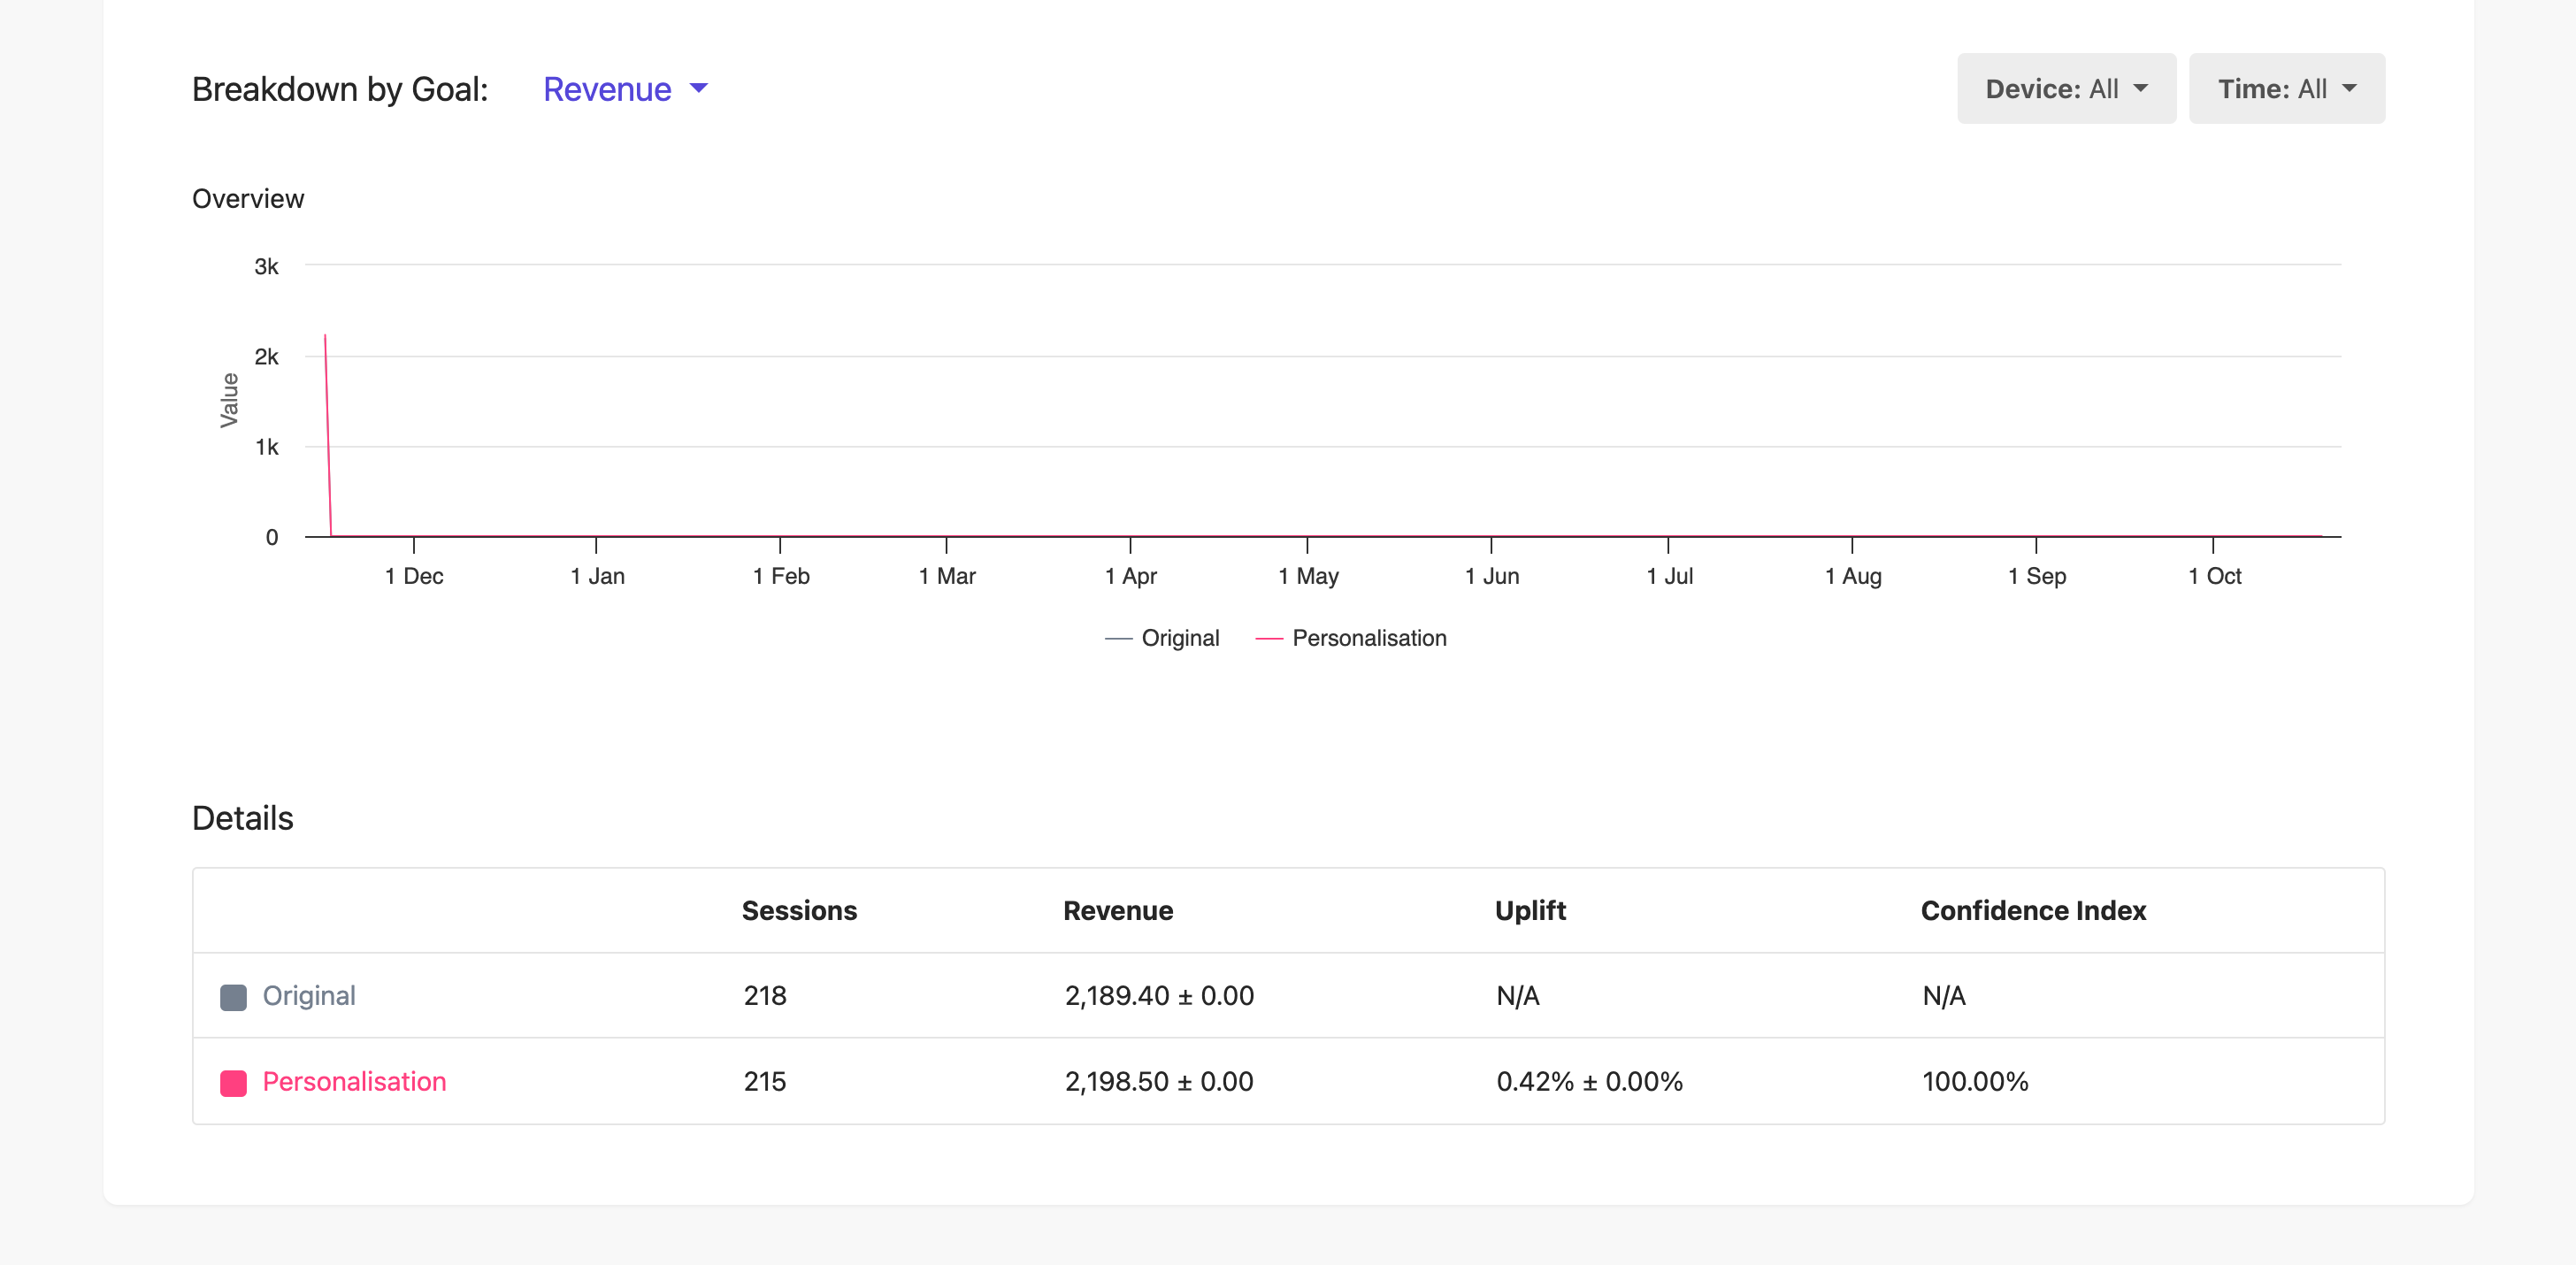
This table contains a description of each screen item on the lower part of the **Performance** screen:
| Screen item | Description |
| --- | --- |
| **Breakdown by Goal** line graph | This line graph lets you compare the performance of all variants against a goal. Click the goal whose metrics you want to see on the line graph, from the drop-down list. The **Breakdown by Goal** and **Details** table update with metrics for the selected goal.
The y axis displays the metric that the variants achieved, as measured against the selected goal. The x axis displays the date range that you want to view results for, based on what you selected from the **Time** filter. Hover your mouse over a data point to see its value. |
| **Device** filter | Click the **Device** you want to filter by. The line graph refreshes to only show metrics for the selected device. This is set to **ALL** by default. |
| **Time** filter | Select the time span by which you want to filter results. You can select **Last 7 Days**, **Last 30 Days**, or **Select date** to enter a date range. This is set to **ALL** by default. |
| **Details** table | This table contains metrics on all variants as measured against the goal you clicked from the **Breakdown by Goal** drop-down list. |
| **Variant Name** column | The name of each variant in the experiment. |
| **Sessions** column | The number of current unique sessions. |
| **Selected Goal** column | Shows the metric for the goal you selected from the **Breakdown by Goal** drop-down list. For example, if you choose **Conversion**, this column displays its value.
The value includes a margin of error (**±** value), representing a 95% confidence level due to sampling noise.
The format is `goalValue` ± `marginOfError`. The calculations are:
- `marginOfError` = `standardError`*`confidenceZscore`
- For a 95% confidence level, `confidenceZscore` = 1.96
- `standardError` is calculated using the same formula as for the **Primary Goal** error range.
|
| **Uplift** column | Shows the percentage difference in the goal metric between the control and the variant, based on the goal you selected from the **Breakdown by Goal** drop-down list.
The value includes a margin of error (**±** value), representing a 95% confidence level due to sampling noise.
The format is `uplift` ± `conversionRateErrorPercentage`. The calculations are:
- `conversionRateErrorPercentage` = 100 * (`marginOfError` /value)
- `marginOfError` = `standardError`*`confidenceZscore`
- `standardError` and `confidenceZscore` are the same as those in the **Selected Goal** column.
|
| **Confidence Index** | A type of [estimate calculated from the statistics of the selected goal](https://doc.sitecore.com/personalize/en/users/sitecore-personalize/introduction-to-experiments-in-sitecore-personalize/using-the-confidence-index-in-an-experiment.html). This estimate is only reliable when the minimum sample size is reached. The higher the confidence index, the higher the probability that the results of the experiment are accurate. |