---
title: "Debug code running in containers"
slug: "debug-code-running-in-containers"
abstract: "This topic shows how debug code that is running in a container."
---
# Debug code running in containers
This topic explains how you use [Visual Studio to diagnose your code](https://docs.microsoft.com/en-us/visualstudio/containers/view-and-diagnose-containers?view=vs-2019) when it is running in a local Docker container.
Before you begin
This guide assumes you are able to build and run custom Sitecore runtime images that include your solution's build output.
You can use the *custom-images* solution from the [Docker Examples repository](https://github.com/Sitecore/docker-examples) if you do not have your own. Follow the [preparation steps](https://doc.sitecore.com/xp/en/developers/104/developer-tools/run-your-first-sitecore-instance.html "Run your first Sitecore instance") or run the included `init.ps1` script to perform these preparation steps automatically.
Prerequisites
To debug apps in a local Docker container, you need the following:
- Visual Studio 2019 version 16.5.0 or later
Ensure debug symbols available
Though not unique to containers, you must ensure that debug symbols have been deployed to the container.
This might already be done if you are building your solution image with the *Debug* build configuration. For example, the *custom-images* example in the Docker Examples repository uses a `BUILD_CONFIGURATION` environment variable that sets this to *Debug* by default.
You can also do a *Debug* file deployment from Visual Studio into the running container.
Attach the Visual Studio debugger
In Visual Studio, you have two options for attaching to a process in a container:
### Option 1: use the Containers window
To use the **Containers** window:
1. If the **Containers** window is not showing, open it from the top **View** menu. Click **Other Windows**, then **Containers**.
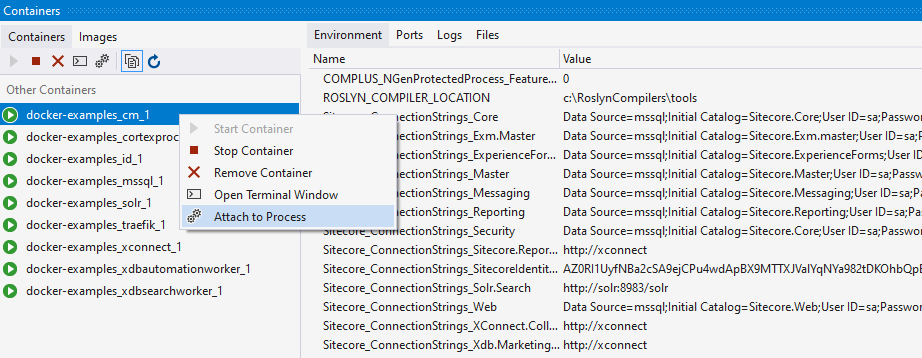
2. In the list of running containers, right-click on the one that you want to debug, and click **Attach to Process**:
3. The **Attach to Process** dialog appears and shows the available processes running in the container:
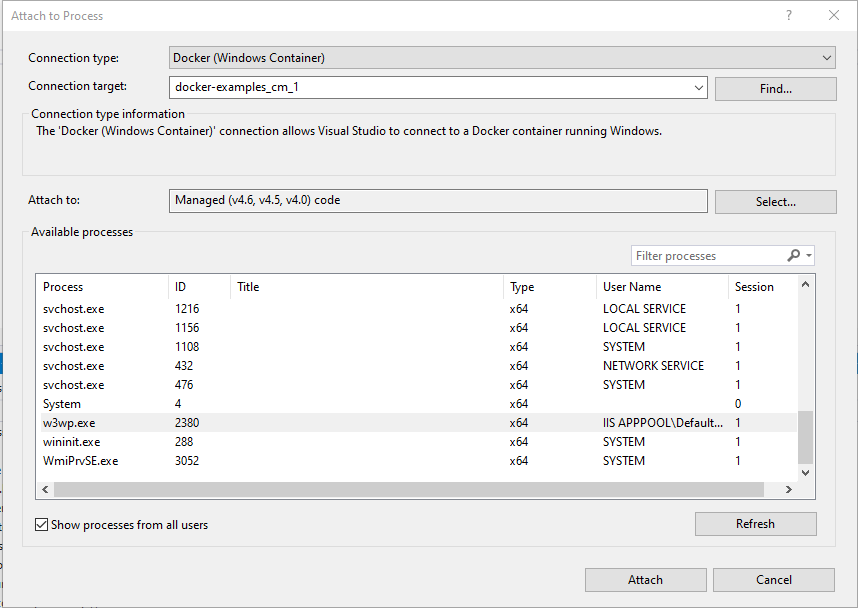
4. For **Attach to Process**, you check that the correct code type is selected. For debugging a CM or CD `w3wp.exe`, this will be **Managed Code (v4.6, v4.5, v4.0)**.
5. Select the process (for example, *w3wp.exe*) as usual (check **Show processes from all users** if not visible), and click **Attach**.
### Option 2: Use the Debug menu
Alternatively, you can also use the **Debug** menu, although this involves a few more steps than the **Containers** window.
To use the **Debug** menu:
1. From the top **Debug** menu, click **Attach to Process** to open the **Attach to Process** dialog.
2. For **Connection type**, click **Docker (Windows Container)**.
3. For **Connection target**, click **Find**. Running containers appear in the list. Select the container you want to debug and click **OK**.
4. For **Attach to**, ensure the correct code type is selected. For debugging a CM or CD `w3wp.exe` file, this is **Managed Code (v4.6, v4.5, v4.0)**.
5. Select the process (for example, *w3wp.exe*) as usual (check **Show processes from all users** if not visible), and click **Attach**.