Experience Analytics reports for Commerce Connect
The Experience Analytics reports are only available in Commerce Connect version 9.0.2 and later.
Sitecore Experience Analytics provides dashboards and reports for marketers and marketing analysts to identify patterns and trends in experience data. There is a group of reports that specifically handles data from Sitecore Commerce Connect. These reports are only available when you have installed Commerce Connect.
In charts that show time-related information, you can change the time resolution in the drop-down menu in the upper right corner of the chart:
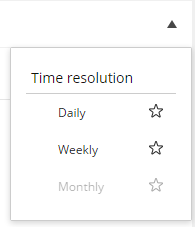
The menu only shows valid selections as enabled. Other selections are disabled.
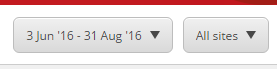
You can filter all reports on two things:
-
Time range
-
Sites to include
You access the filters by clicking the buttons at the top of the report:
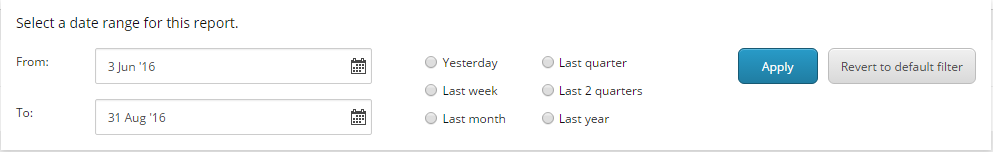
You can set the time range in a number of ways:
The following Commerce Connect reports are available on the Commerce tab in Experience Analytics:
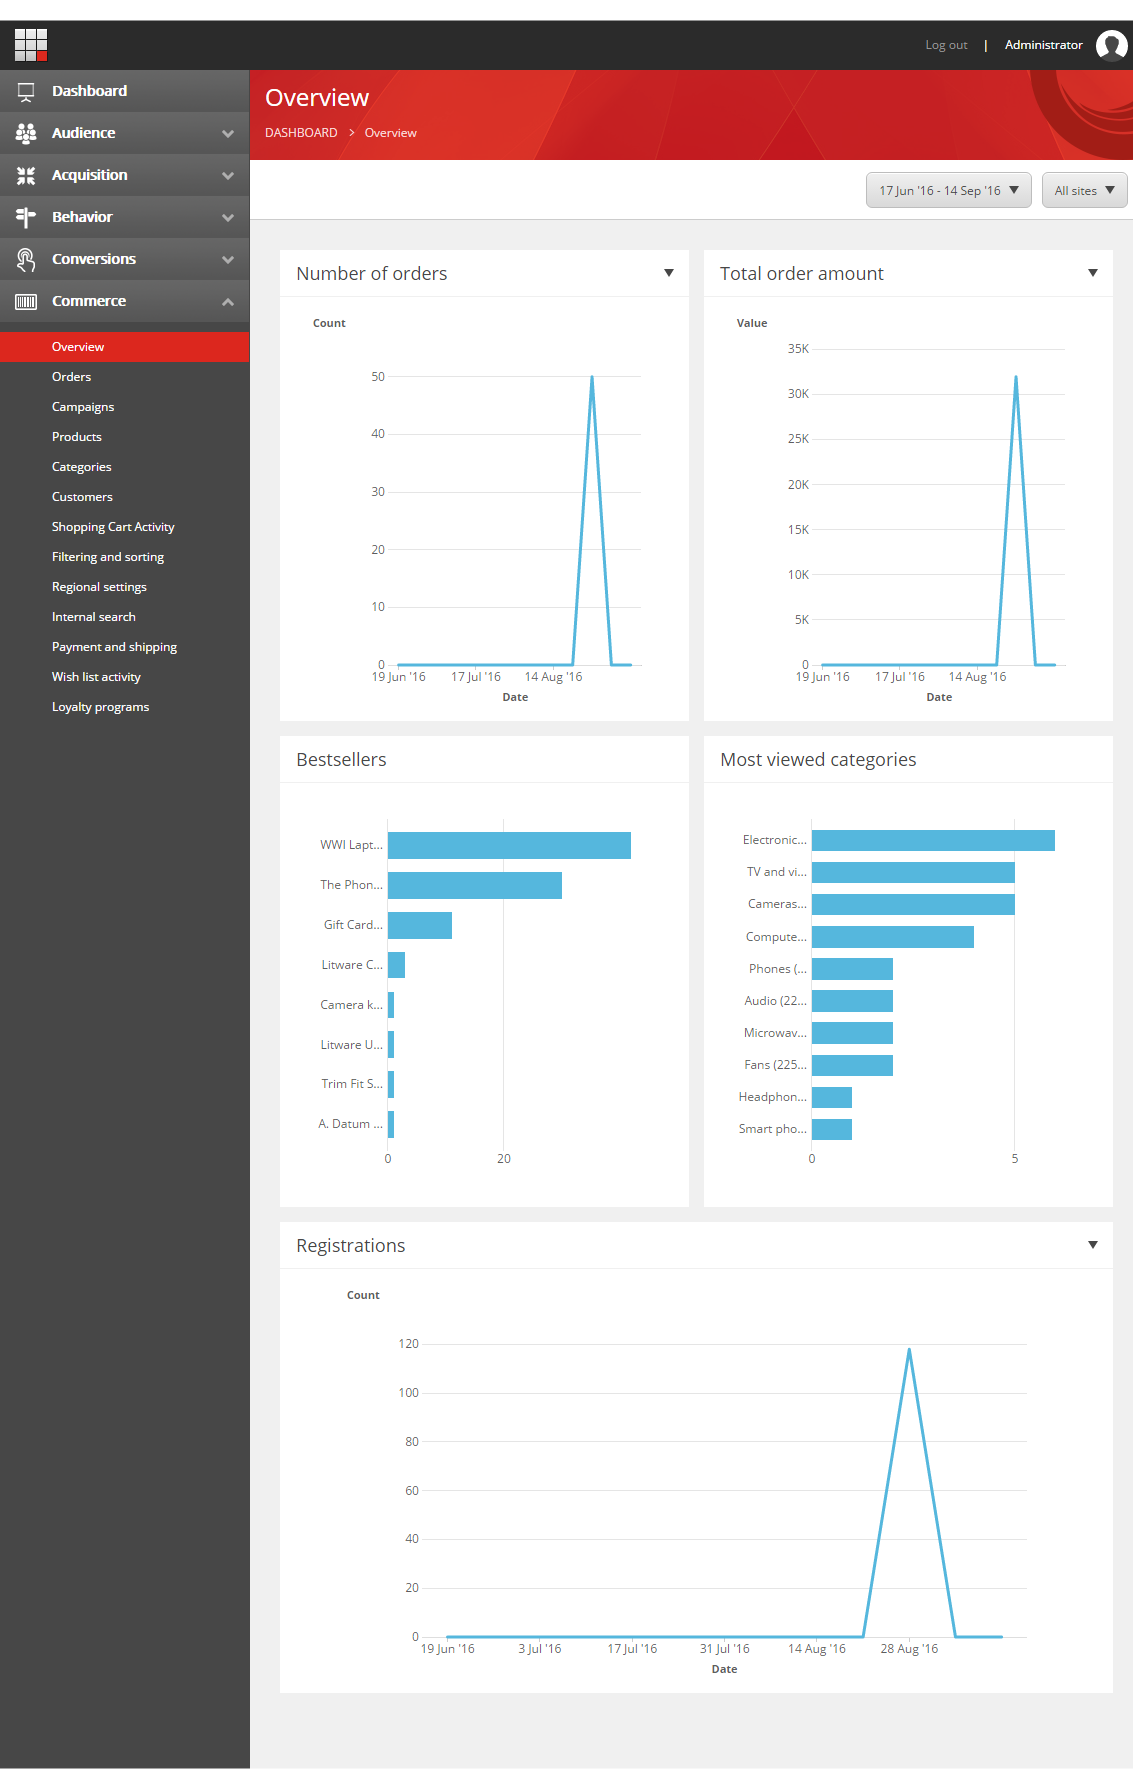
The Overview report
The Overview report
The Overview report contains five charts that provide a general overview of Commerce Connect activities.
|
Chart |
Description |
|---|---|
|
Number of orders |
Shows the total number of orders, broken down by the selected time resolution. |
|
Total order amount |
Shows the total value of the orders, broken down by the selected time resolution. |
|
Bestsellers |
Shows the number of sold items for the best-selling items. |
|
Most viewed categories |
Shows the categories that have the most views. |
|
Registrations |
Show the number of visitors that are registered, broken down by the selected time resolution. |
The Orders report
The Orders report
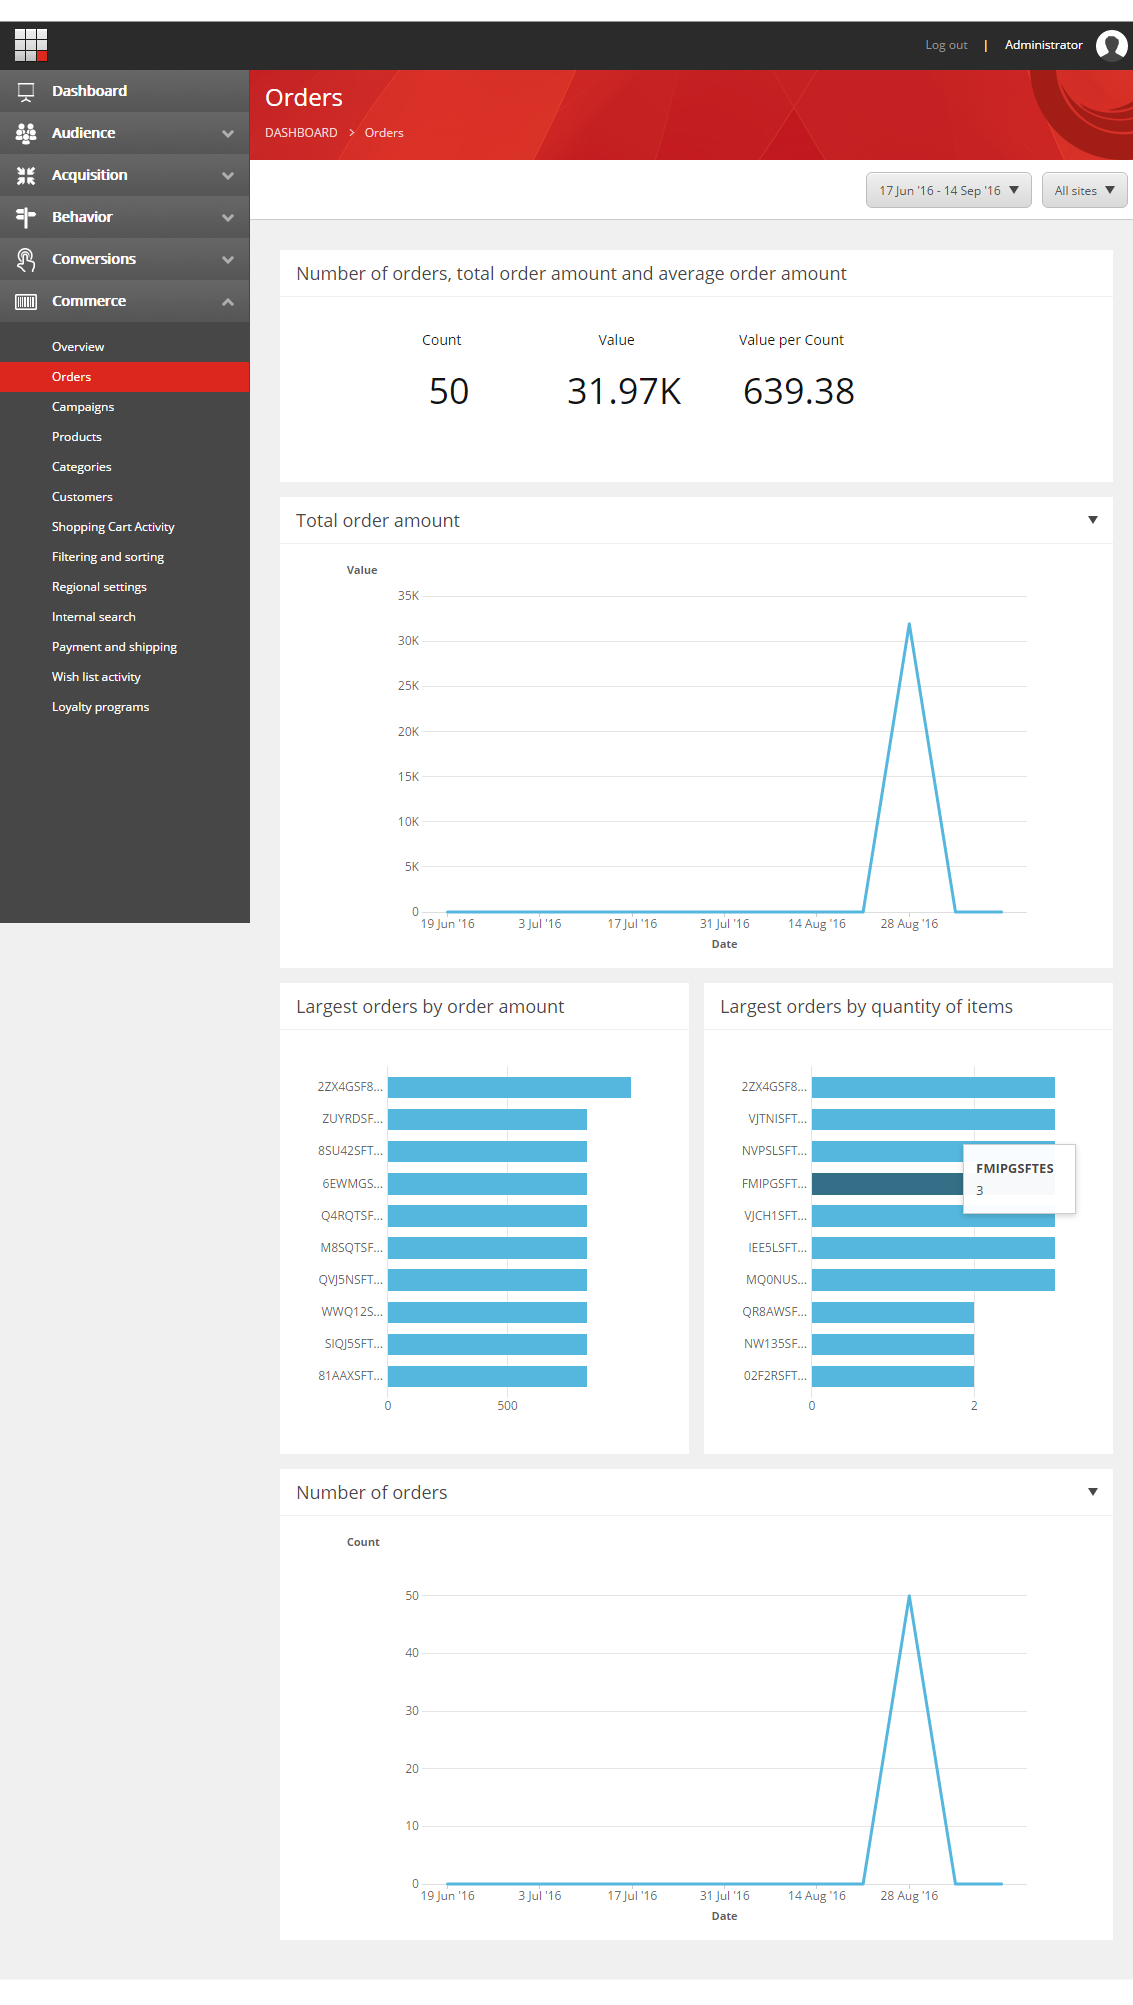
The Orders report shows summary information about orders (number of orders, total order amount, and average order amount), and contains four charts that provide more detailed information.
|
Chart |
Description |
|---|---|
|
Total order amount |
Shows the total value of the orders, broken down by the selected time resolution. |
|
Largest orders by order amount |
Shows the top orders by value. |
|
Largest orders by quantity of items |
Shows the top orders by number of items in the order. |
|
Number of orders |
Shows the total number of orders, broken down by the selected time resolution. |
The order IDs shown can be arbitrary strings, depending on the external commerce system used. The order IDs are in the form of GUIDs in the screenshots.
The Campaigns report
The Campaigns report
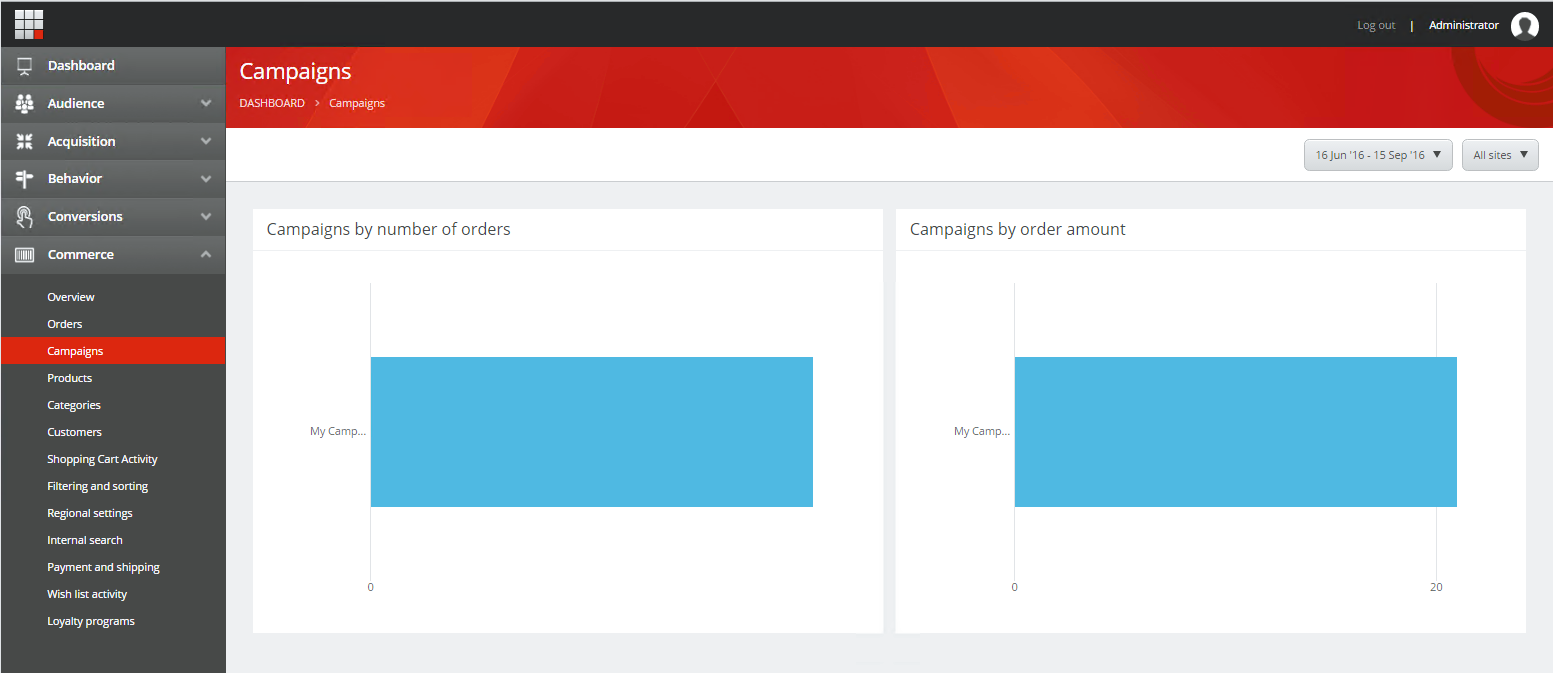
The Campaigns report contains two charts that provide information about campaigns.
|
Chart |
Description |
|---|---|
|
Campaigns by number of orders |
The top campaigns that generate most orders. |
|
Campaigns by order amount |
The top campaigns by the amount (value) or the orders they generate. |
For both charts, the condition is that the first page visit in the interaction is tagged as a campaign (landing page) and that one or more orders are placed as part of the same interaction. This means that visitors who arrive on a landing page as part of a campaign but do not place an order as part of the initial interaction/session do not count.
The Products report
The Products report
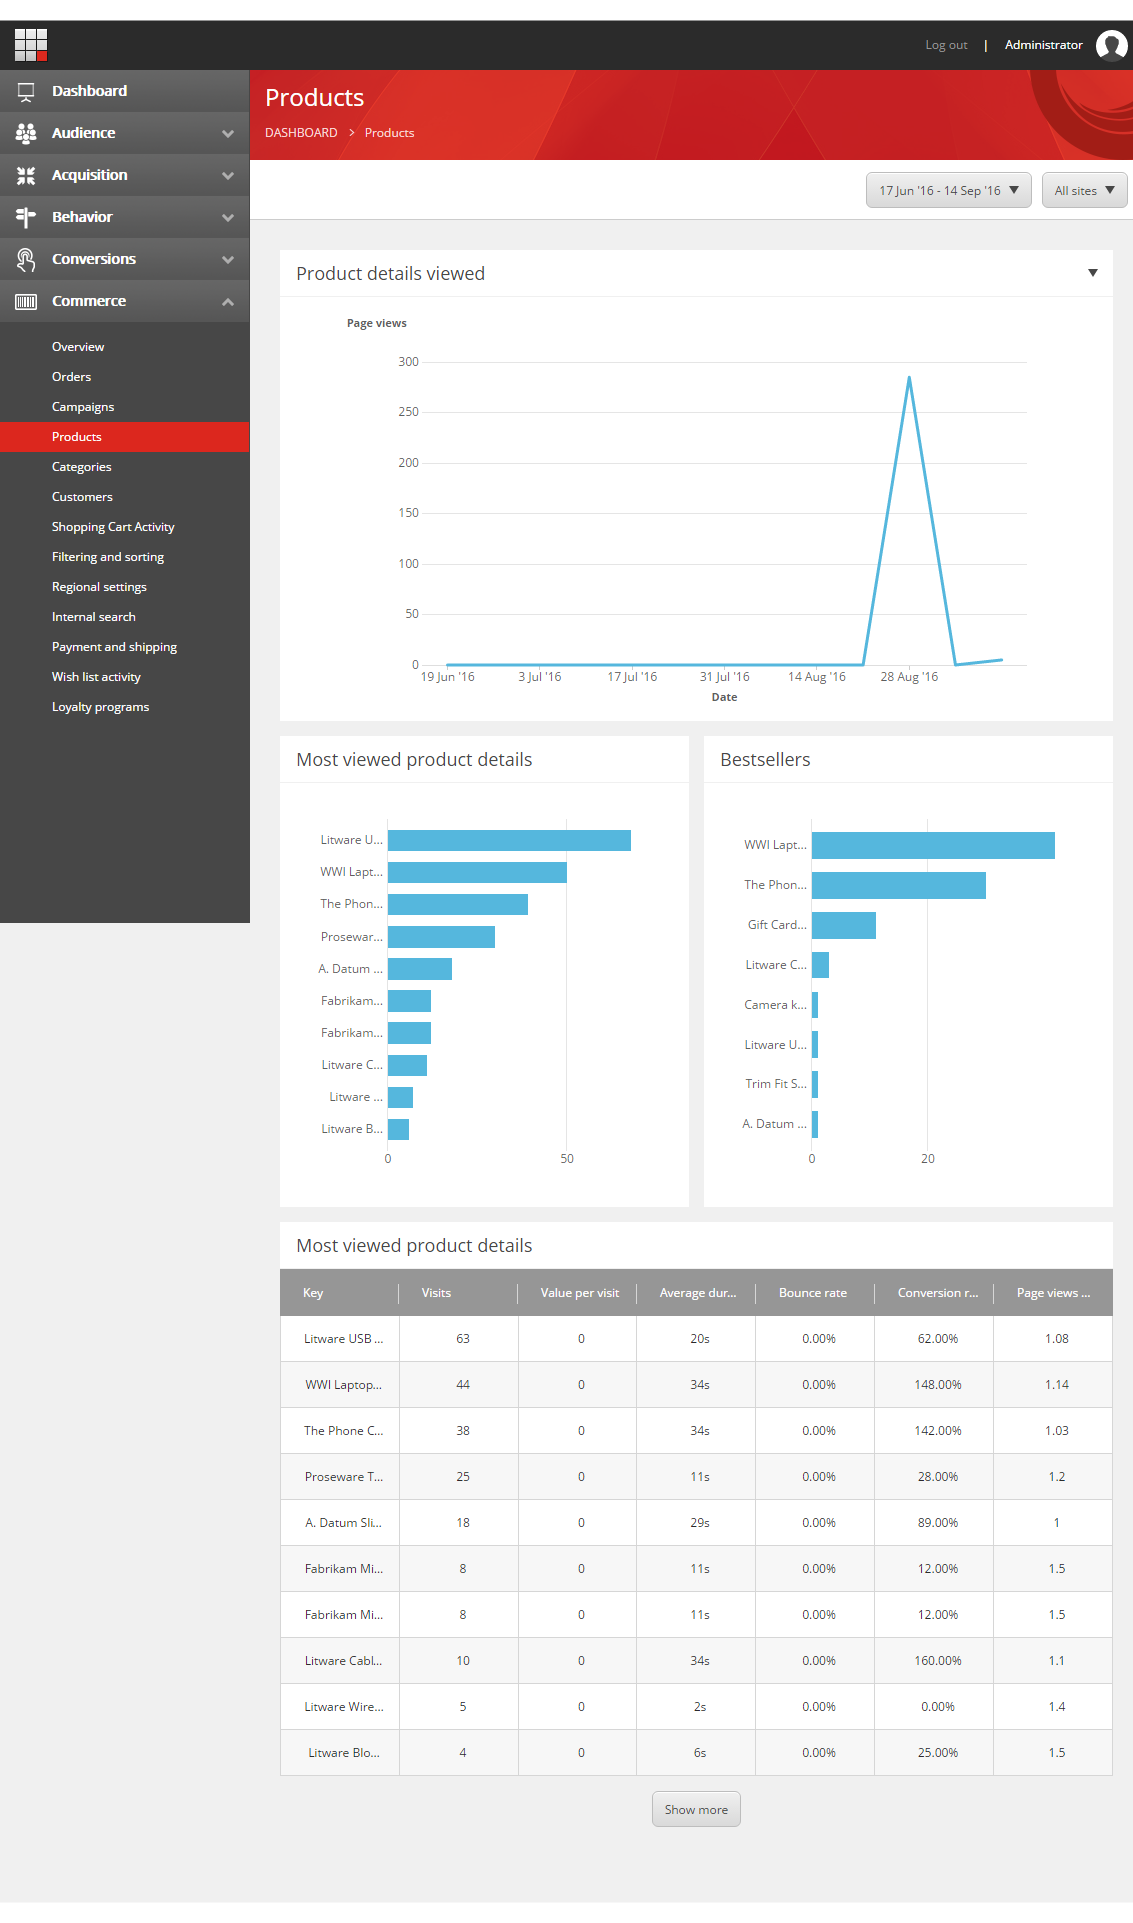
The Products report contains three charts and a table that provide information about products.
|
Chart |
Description |
|---|---|
|
Product details viewed |
Shows the total number of product detail views, broken down by the selected time resolution. |
|
Most viewed product details |
Shows the top products by detail views. |
|
Bestsellers |
Shows the top selling products by sales. |
The Most viewed product details table shows the same data as the chart with the same title, but it includes more detail:
|
Column |
Description |
|---|---|
|
Key |
The product. |
|
Visits |
Number of visits to the product details page. |
|
Value per visit |
The engagement value of each visit to the product details page. |
|
Average duration |
Average amount of time visitors spent on the product details page. |
|
Bounce rate |
Percentage of visitors that left the site after visiting the product details page. |
|
Conversion rate |
The conversion rate of the visitors that viewed the product details page. |
|
Page views per visit |
The average number of site pages a visitor to this product details page visited. |
The Categories report
The Categories report
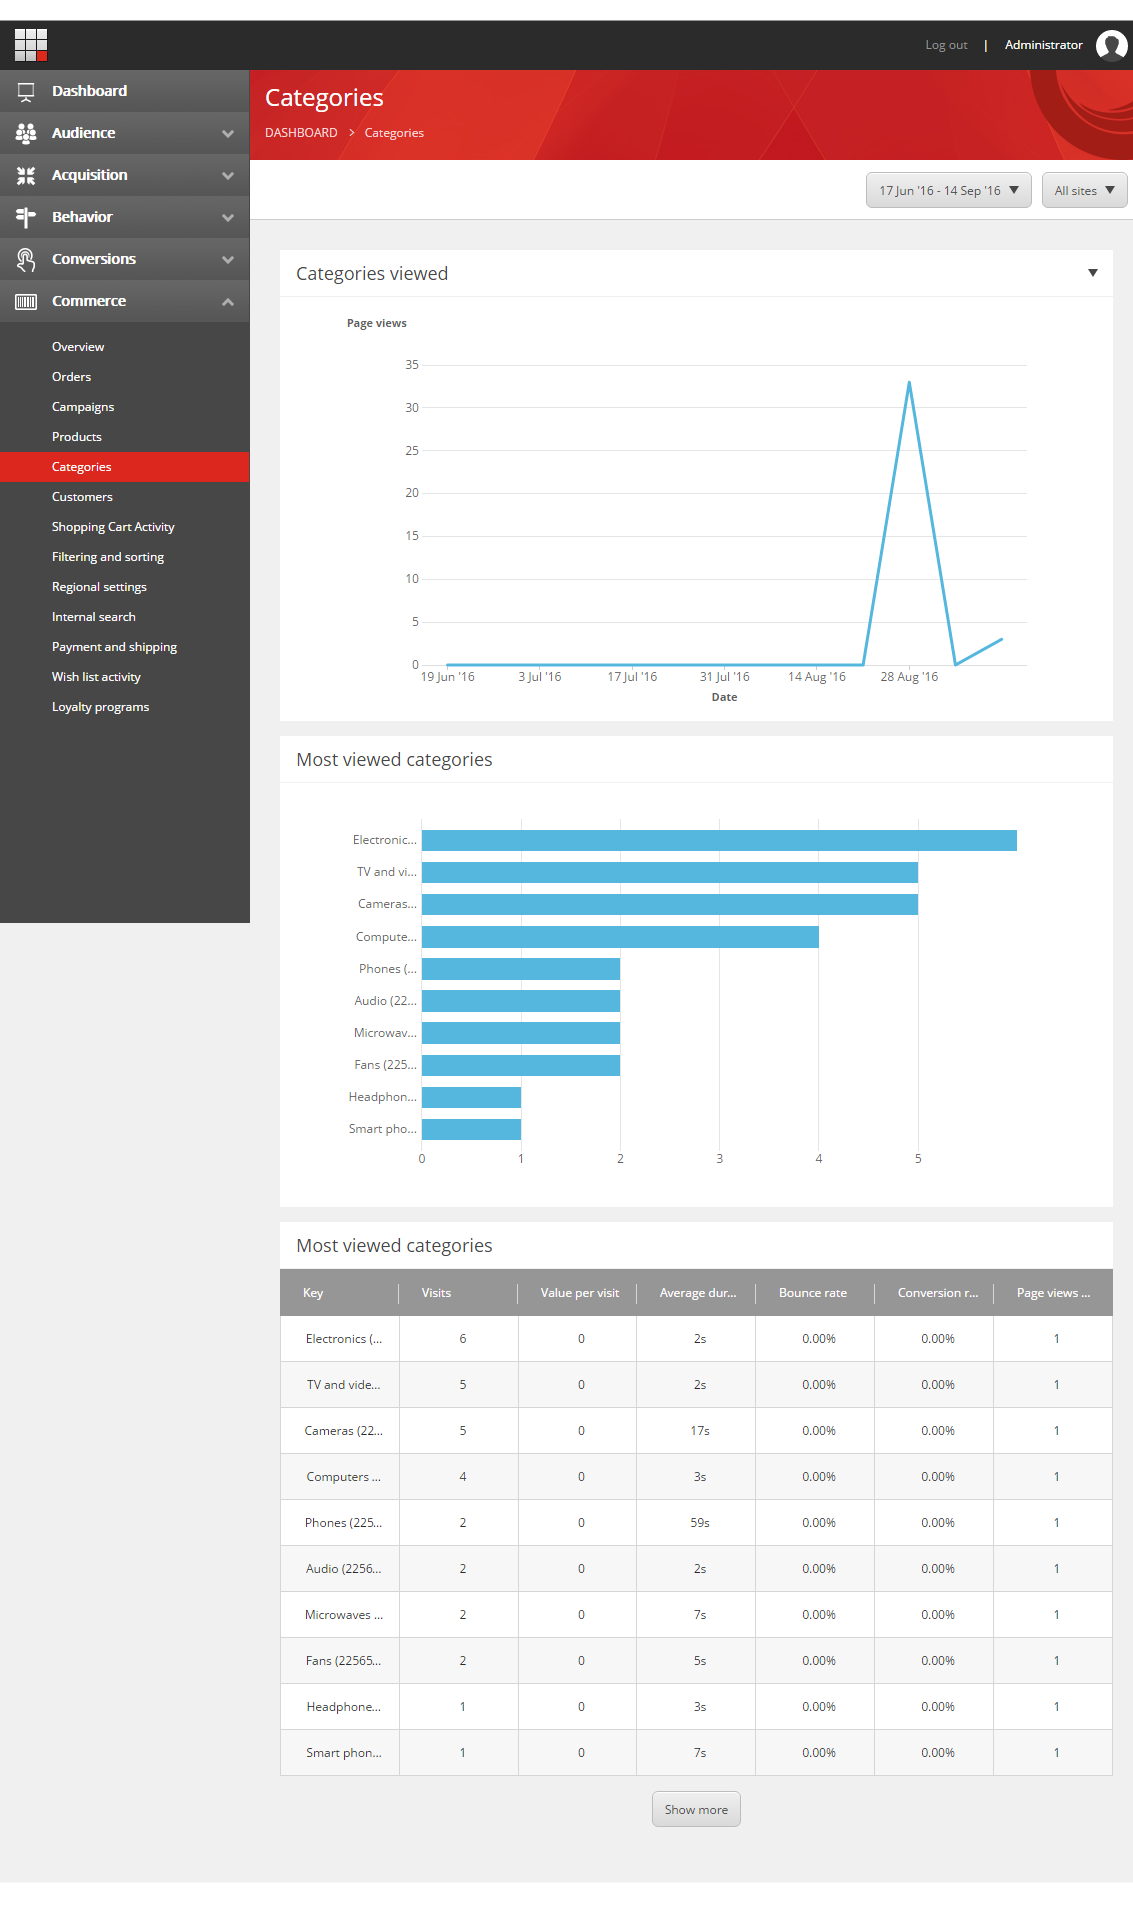
The Categories report contains two charts and a table that provide information about categories.
|
Chart |
Description |
|---|---|
|
Categories viewed |
Shows the total number of category views, broken down by the selected time resolution. |
|
Most viewed categories |
Shows the top categories by views. |
The Most viewed categories table shows the same measurement as the chart with the same title, but it includes more detail:
|
Column |
Description |
|---|---|
|
Key |
The category. |
|
Visits |
Number of visits to the pages in the category. |
|
Value per visit |
The engagement value of each visit to the pages in the category. |
|
Average duration |
Average amount of time visitors spent on pages in the category. |
|
Bounce rate |
Percentage of visitors that left the site after visiting pages in the category. |
|
Conversion rate |
The conversion rate of the visitors that viewed pages in the category. |
|
Page views per visit |
The average number of site pages a visitor to pages in the category visited. |
The Customers report
The Customers report
The Customers report contains a summary overview, five charts, and two tables that provide information about customers.
A contact refers to an individual whereas a customer can represent an individual in B2C scenarios and businesses or organizations in B2B scenarios. It is the customer that pays for the order and the contact that places the order
The charts are:
|
Chart |
Description |
|---|---|
|
Registrations |
Shows the total number of customers that registered . |
|
Top customers by total order amount |
Shows the top customers by total value of order. |
|
Top customers by number of orders |
Shows the top customers by number of orders. |
|
Top contacts by total order amount |
Shows the top contacts by total value of order. |
|
Top contacts by number of orders |
Shows the top contacts by number of orders. |
The four tables are:
-
Customers by total order amount
-
Customers by number of orders
-
Contacts by total order amount
-
Contacts by number of orders
These tables show the same data as the charts to which they correspond, but they add more information. The columns are:
|
Column |
Description |
|---|---|
|
Key |
The customer or contact. |
|
Visits |
Number of visits to pages for this customer or contact. |
|
Value per visit |
The monetary value of each visit to the pages for this customer or contact. |
|
Average duration |
Average amount of time the customer or contact spent per visit. |
|
Bounce rate |
Percentage of customers or contacts that left the site after visiting one page. |
|
Conversion rate |
The conversion rate of the customer or contact. |
|
Page views per visit |
The average number of site pages the customer or contact visited per visit. |
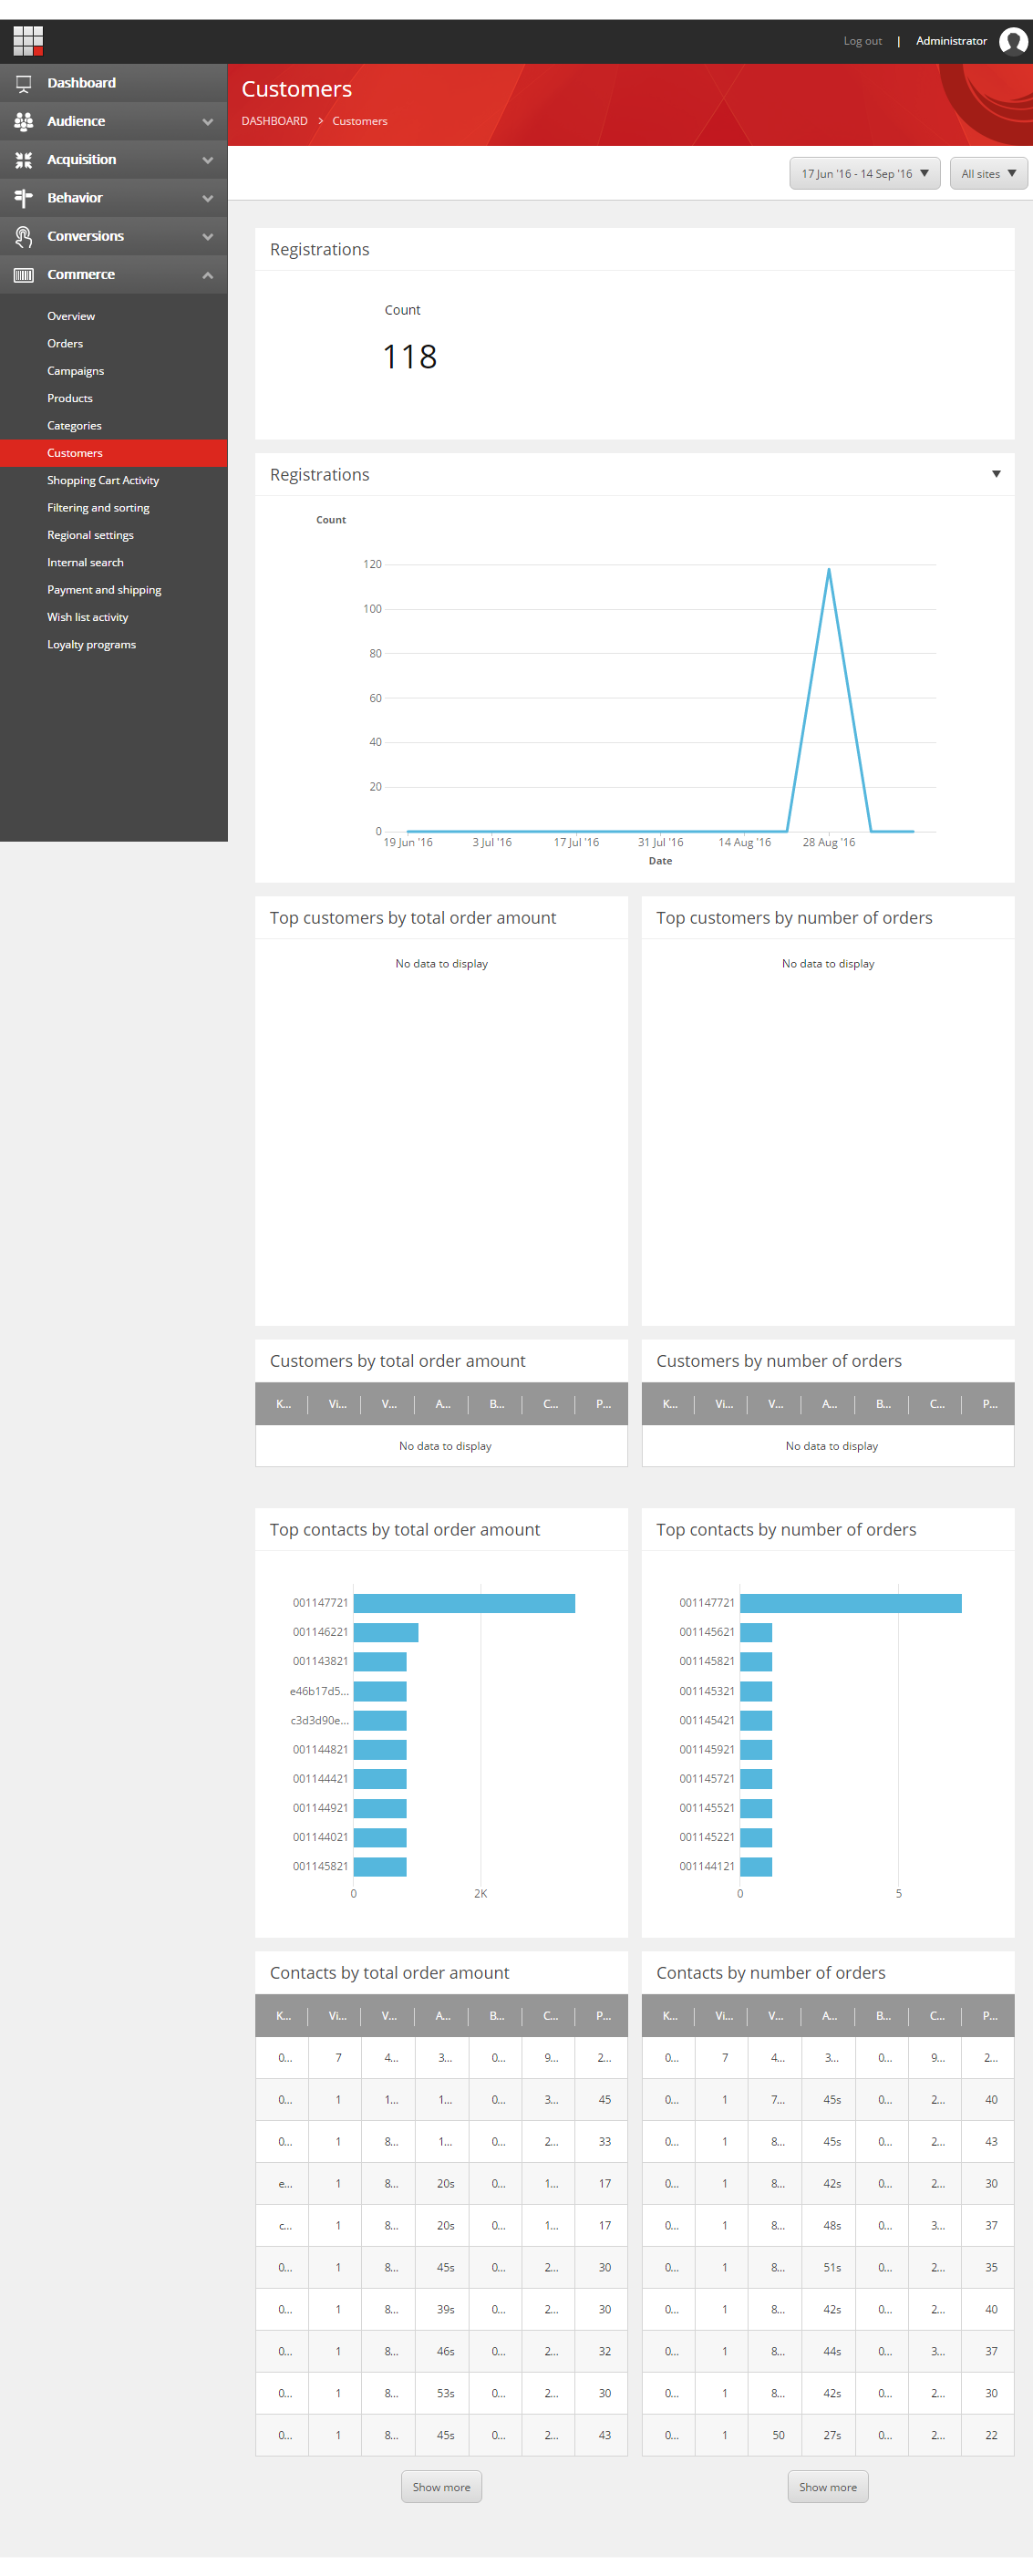
Sitecore Experience Platform assigns a GUID to anonymous visitors and once an account is created, an account ID is shown. This is why some contacts are represented by a GUID and some by an integer number in the screenshot.
The Shopping cart activity report
The Shopping cart activity report
The Shopping cart activity report shows information about shopping carts and the activities around them. There are three charts:
|
Chart |
Description |
|---|---|
|
Products most frequently removed from the cart |
Shows the top products most frequently removed from a shopping cart. |
|
Products most frequently added to the cart |
Shows the top products most frequently added to a shopping cart. |
|
Products most frequently updated on the cart |
Shows the top products most frequently updated in a shopping cart. |
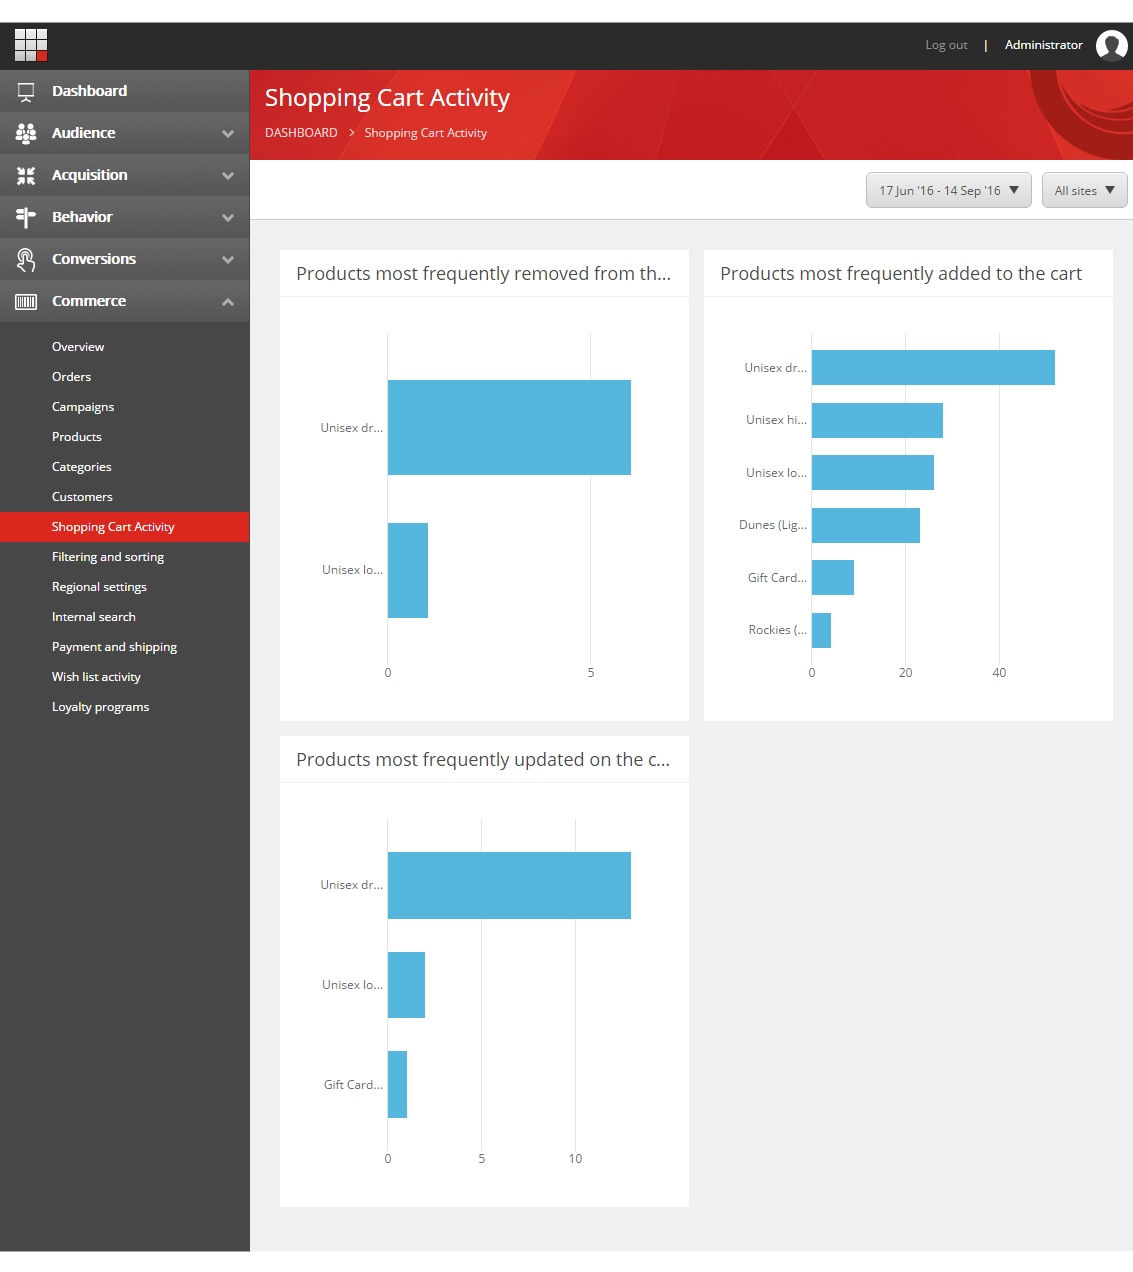
For each item, the product name is retrieved (when possible) and the product ID is shown in parentheses. To retrieve the product name, the property SitecoreItemID must be populated on the CartProduct for each cart line.
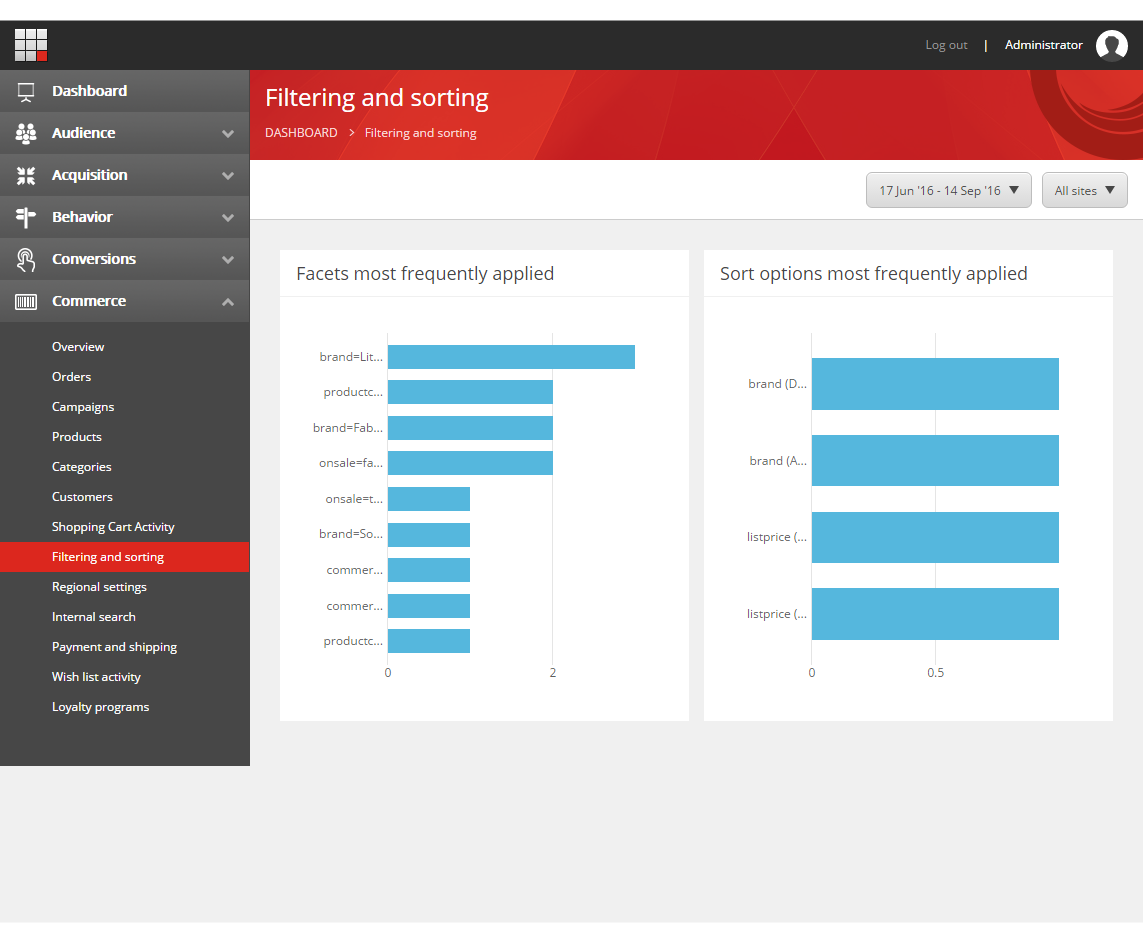
The Filtering and sorting report
The Filtering and sorting report
The Filtering and sorting report contains two charts with information about the filtering and sorting options visitors most frequently use.
|
Chart |
Description |
|---|---|
|
Facets most frequently applied |
Shows the top facets most frequently applied by visitors. |
|
Sort options most frequently applied |
Shows the top sort options most frequently applied by visitors. Sort order is reflected in the label. |
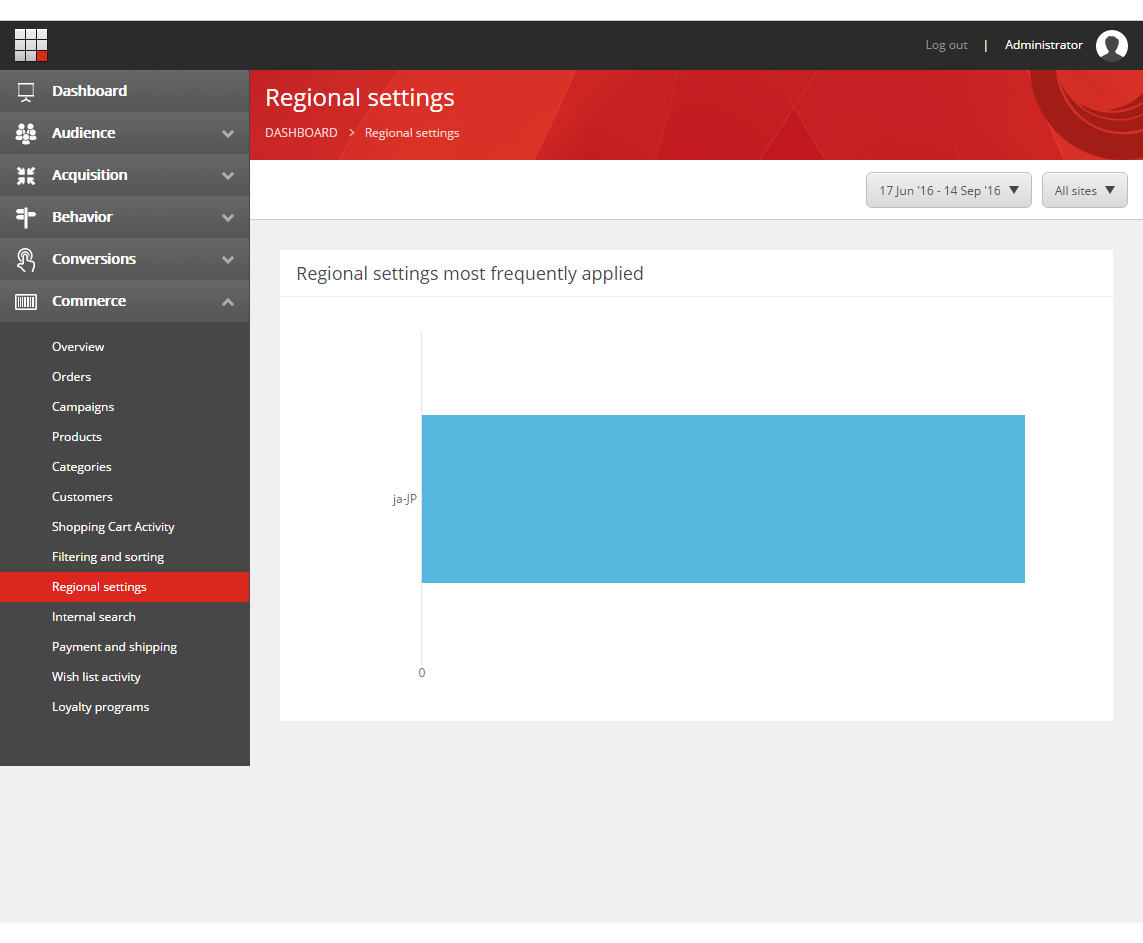
The Regional settings report
The Regional settings report
The Regional settings report contains one chart with information about the top regional settings used by visitors in the storefront.
The Internal search report
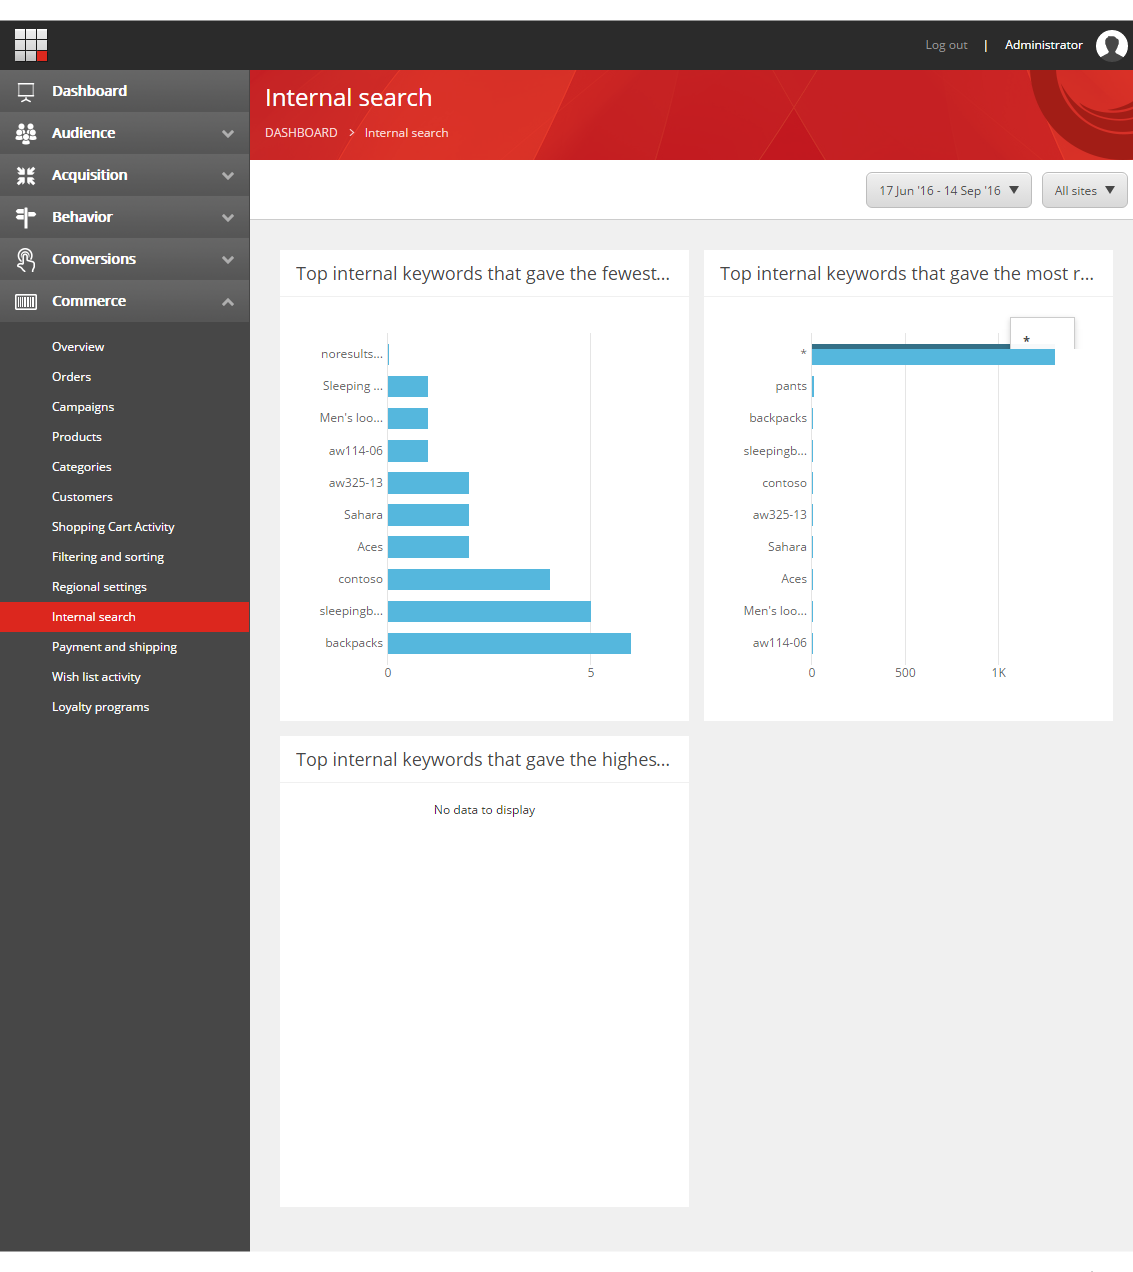
The Internal search report
The Internal search report contains three charts that provide information about how visitors use the internal search on the site.
|
Chart |
Description |
|---|---|
|
Top internal keywords that gave the fewest results |
The top keywords visitors used that gave the fewest search results. |
|
Top internal keywords that gave the most results |
The top keywords visitors used that gave the most search results. |
|
Top internal keywords that gave the highest revenue |
The top keywords visitors used that gave the highest revenue. |
The Payment and shipping report
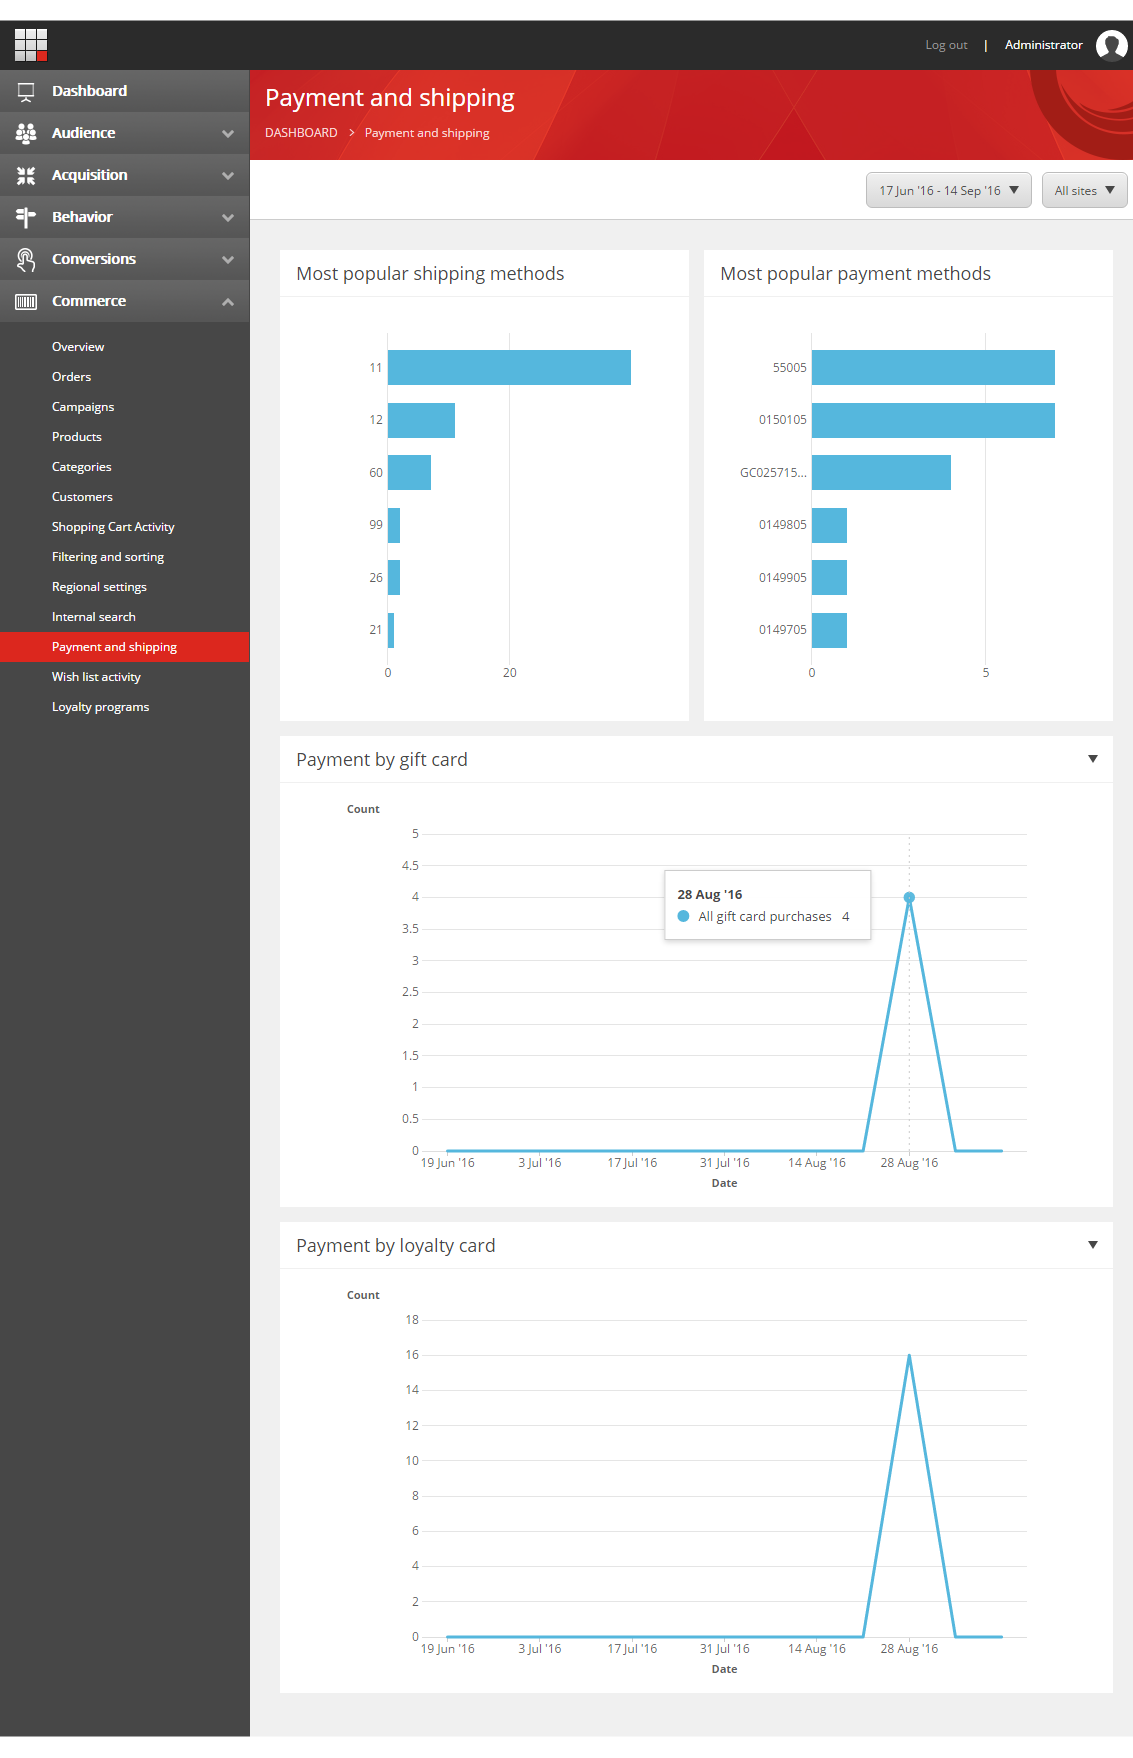
The Payment and shipping report
The Payment and shipping report contains four charts with information about payment and shipping preferences..
|
Chart |
Description |
|---|---|
|
Most popular shipping methods |
Shows the top shipping methods. |
|
Most popular payment methods |
Shows the top payment methods. |
|
Payment by gift card |
Shows the number of payments by gift card, broken down by the selected time resolution. |
|
Payment by loyalty card |
Shows the number of payments by loyalty card, broken down by the selected time resolution |
Items listed for both shipping and payment methods refer to the internal IDs used in the external commerce systems.
The Wish list activity report
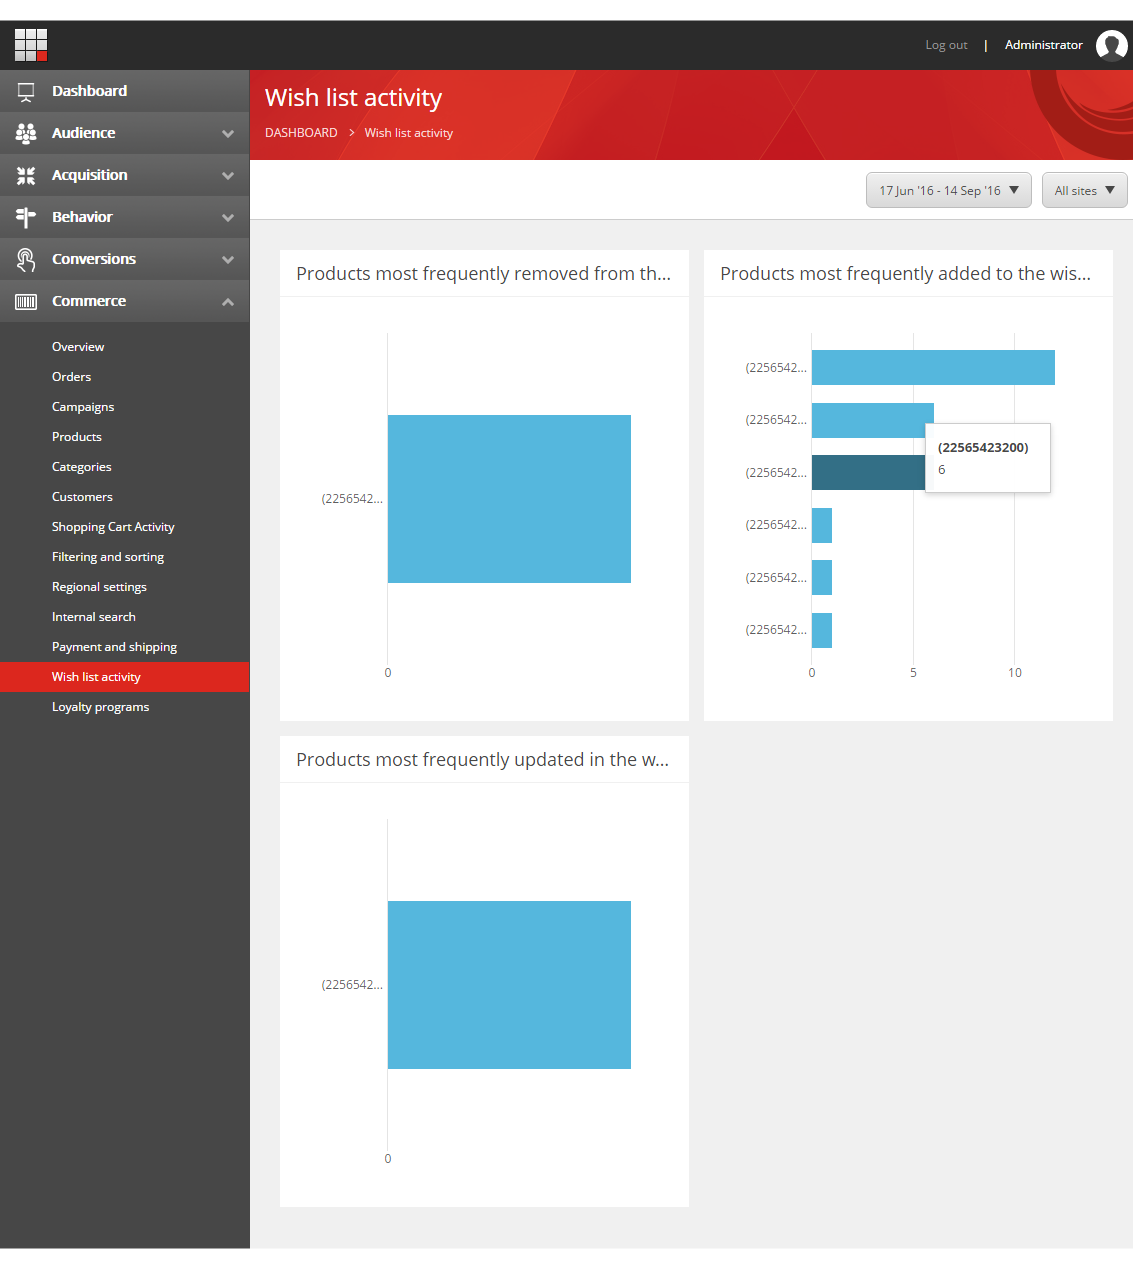
The Wish list activity report
The Wish list activity report contains three charts with information about how customers use wish lists
|
Chart |
Description |
|---|---|
|
Products most frequently removed from the wish list |
Shows the top products most frequently removed from a wish list. |
|
Products most frequently added to the wish list |
Shows the top products most frequently added to a wish list. |
|
Products most frequently updated in the wish list |
Shows the top products most frequently updated in a wish list. |
The Loyalty programs report
The Loyalty programs report
The Loyalty programs report shows information about loyalty programs in two charts.
|
Chart |
Description |
|---|---|
|
Loyalty program enrollment |
Shows the total number of customers enrolling in a loyalty program, broken down by the selected time resolution. |
|
Most popular loyalty programs |
Shows the top loyalty programs, based on total enrollment. |
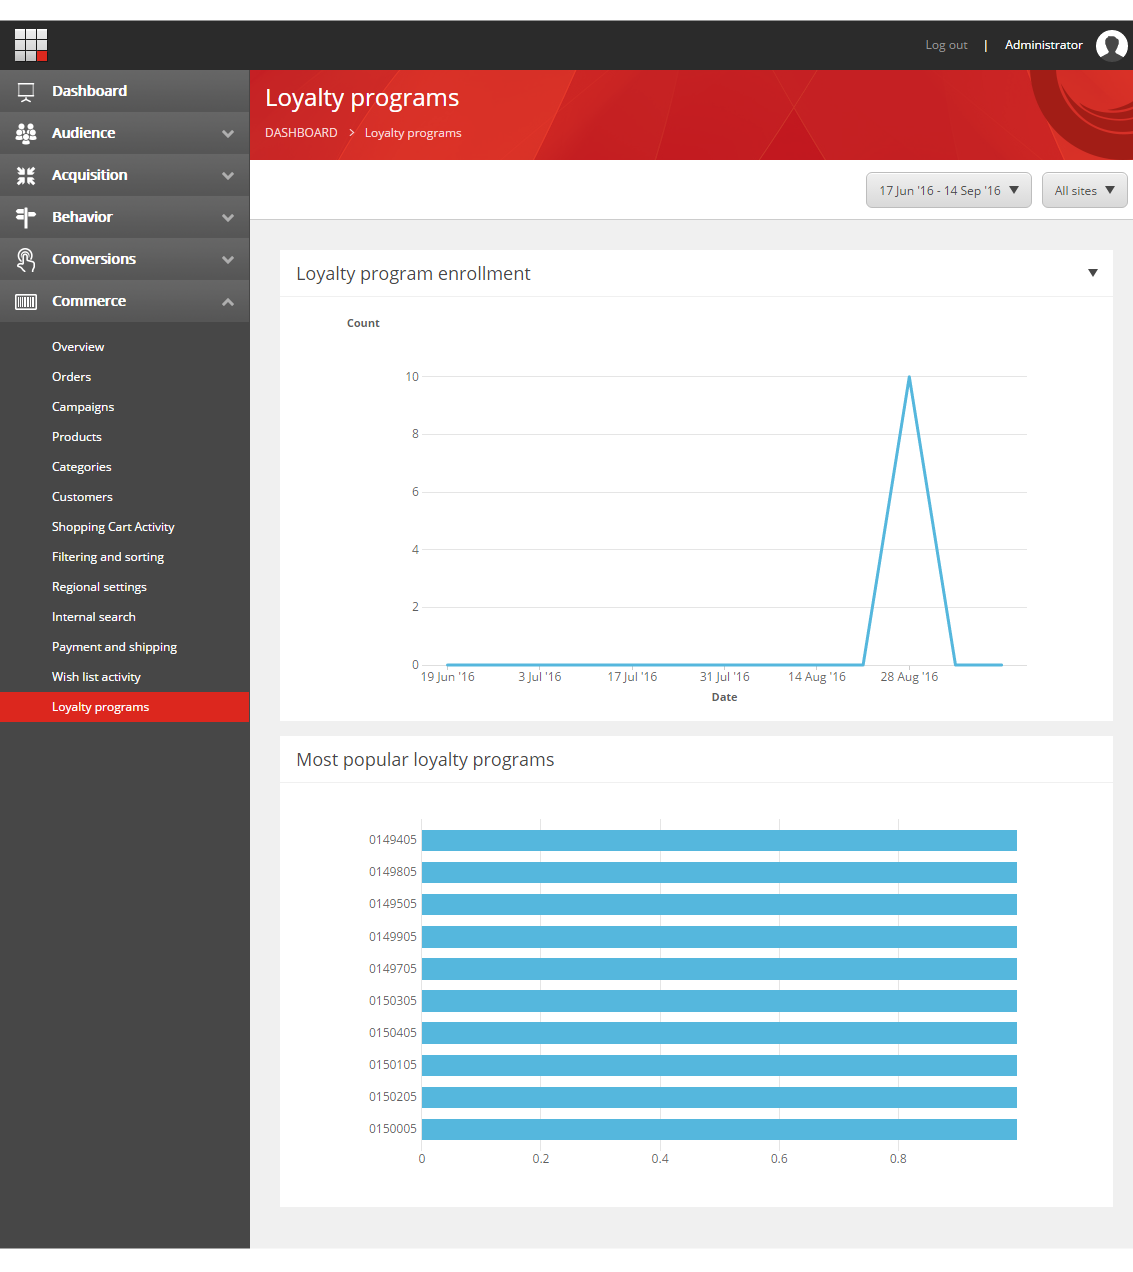
Items listed for loyalty programs are referred to by the internal IDs used in the external commerce systems.