Working with the collected data
After you set up tracking, the events with all their data are sent to Sitecore, and the data becomes available in the various Sitecore DXP products your organization has access to. The collected data is used across your Sitecore apps.
Although tracking capabilities are available automatically, you must create a support case for any changes to the tracking configuration. This includes adding, removing, and configuring a site or destination. Creating a support case is to ensure that all of your sites are included in the tracking configuration. If any sites are not included, analytics data will not be collected for those sites.
Viewing the collected data
If you have SitecoreAI, you can view site visitor profiles. Profile data largely depends on the events you capture on your site. For each profile, you can also use inspect mode to view the underlying JSON data for profiles and sessions, including event data.
In SitecoreAI, you can also view site, page, and SitecoreAI form insights and trends in the sites dashboard.
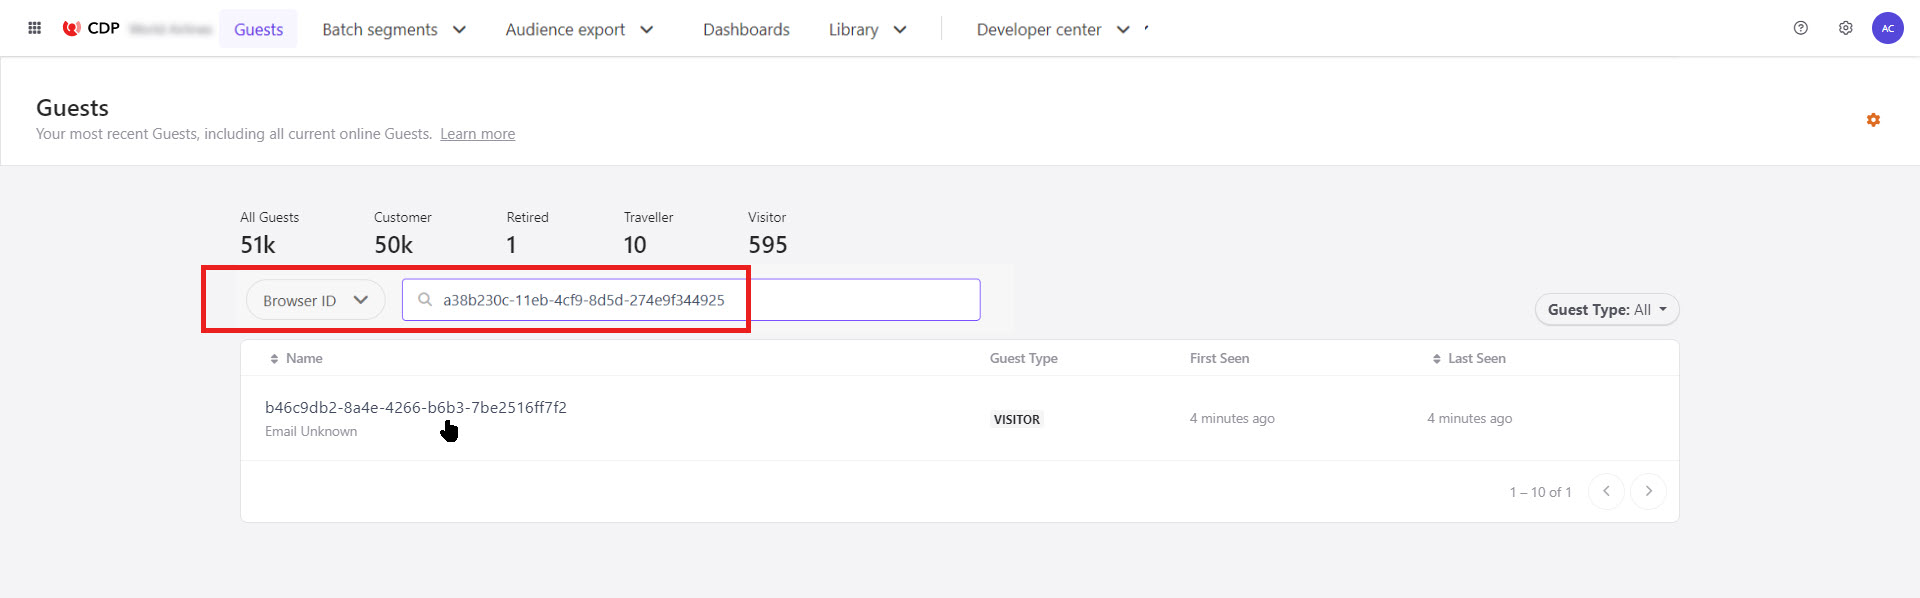
If you have Sitecore CDP, or both Sitecore CDP and Sitecore Personalize, you can view the collected data using the site visitor's browser ID: click Guests, select Browser ID in the search dropdown, and in the search field, enter the site visitor's browser ID, such as a38b230c-11eb-4cf9-8d5d-274e9f344925. Then, in the Guest type drop-down list, click All.
Some code examples, images, and UI labels may still use XM Cloud while engineering assets are being updated.
Sitecore CDP lists the guest profile for the site visitor. In the guest profile, you can find detailed session and event data about your site visitor.
Detailed session and event data only appears if debug mode is enabled in Sitecore CDP.
If you have Sitecore Personalize but not Sitecore CDP, you can view the collected data using the site visitor's browser ID: click Developer center > Event viewer, select Browser ID in the search dropdown, and in the search field, enter the site visitor's browser ID, such as a38b230c-11eb-4cf9-8d5d-274e9f344925.
For every site visitor, you can use:
- The Timeline to see a history of the site visitor's interactions with your app.
- The Event Viewer to see a list of all the events that trigger as the site visitor interacts with your app.
During development, you can view events in real time, as they occur in your app, in Sitecore Search > Developer Resources > Event Monitor. Paste the browser ID, such as a38b230c-11eb-4cf9-8d5d-274e9f344925, in the UUID field, then click Start Monitoring. Doing this starts recording events. Next, send an event from your app, and then verify that it appears in the Event Monitor.
To view the collected data outside the Event Monitor, you need to wait for the events to be processed. Events are processed once a day at 4:00 AM UTC. After they are processed, you can view the collected data in:
- Site Performance to see reports of the number of page views, widget views, widget clicks, and more.
- Widgets > a widget of your choice > Widget performance to see the performance of an individual widget.
- Content collection > Visitors > Visitor Lookup to see data for a site visitor by pasting the browser ID in the Visitor ID field.
Working with the collected data
Marketers at your organization can use the collected data in the various Sitecore DXP products.
| Sitecore DXP product | How to use the data |
|---|---|
| SitecoreAI | View profile data, which helps marketers make informed decisions about campaigns, strategies, and personalization.Create audiences to personalize user experiences. |
| Sitecore CDP | Build segments of site visitors.Export site visitor data to activate audiences in external systems.View performance metrics in prebuilt analytics dashboards. |
| Sitecore Personalize | Run experiments to determine which content resonates the most with each site visitor.Create personalized content. |
| Sitecore Search | Optimize and improve search experiences based on performance metrics and reports.Personalize search results. |