Content test results
Basic content tests and page tests stop automatically when a test winner has been found or the maximum test duration has passed. Compnent tests (A/B, multivariate and personalization tests) do not stop automatically. You must either approve the winner of the test, or select a winner manually. This topic describes how to review content test results while a test is in progress.
Even if a winner has been found in a component test, you must take action to end the test.
For component tests, Sitecore automatically sends an email message to the user who started the test when the test finds a winner or reaches maximum duration. The email message contains a link that you can click to see test results.
To configure Sitecore to send email messages to Sitecore users, follow the instructions to enable the forgotten password functionality.
For all types of test, while the test is in progress, you can navigate to the page in the Experience Editor and open the test results from the Optimization tab on the Experience Editor ribbon.
A red dot on the tab indicates that there is an active test on the page. The following is an example of the Optimization tab on the Experience Editor ribbon:

If there is an active test, the Status shows how many visitors are required for the test to finish. In this example, the status shows that it will take another 5450 visitors to finish the test. If there is enough historical data, the status instead shows the number of days it will take for the test to finish.

Test results
Test results
In the Experience Editor ribbon, you can click Test result on the Optimization tab to see the current test result report for the page.
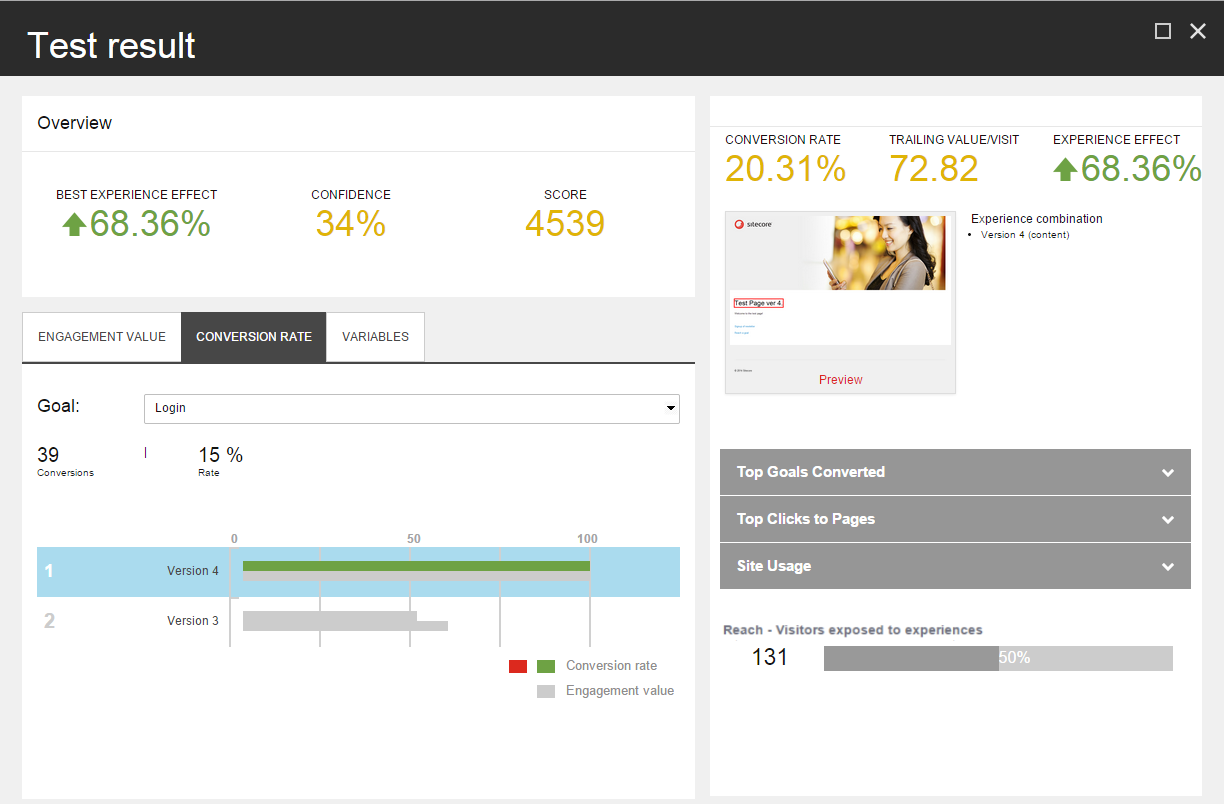
The Overview shows:
-
Best experience effect – the performance of the best performing experience, calculated as the difference in percent between the trailing value per visit of the original and the best experience in the test.
-
Confidence – the statistical confidence level that the test has reached.
-
Score – the test score assigned to the creator of the test, based on the engagement value gained and the importance of the tested page.
If the original experience has the highest trailing value per visit, there is no effect, and therefore no score is calculated. The Best experience effect and Score fields then display  .
.
If there are fewer than 100 visits, the confidence level is 0, and the field displays :

The Engagement value, Conversion rate, and Variables tabs show bar charts with the tested experiences. When you select one of the experiences, the Details panel shows details about this experience.
Below the Details panel, there are three expandable sections with more information about the currently selected experience.
Engagement value
Engagement value
The Engagement value tab contains a graph that lists the experiences in the test in order of their performance, as measured in terms of engagement value. The experience with the highest engagement value is assigned a value of 100, and the bars in the chart indicate the relative performance of the remaining experiences.
The length of the bar indicates the relative engagement value of the experience, calculated as follows:
(Engagement Value for the experience / Engagement Value of best performing experience) x 100
The color of the bar indicates the following:
-
Gray - the original experience.
-
Green - an experience that performs better than the original experience.
-
Red - an experience that performs worse than the original.
Select an experience to see this information in the Details panel:
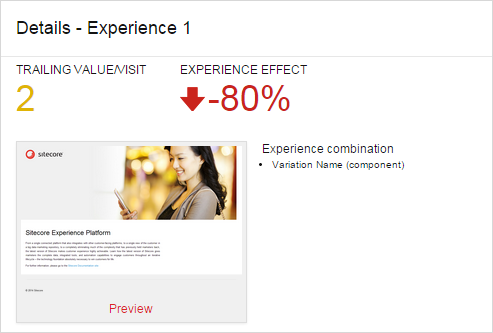
There are two general measurements for the selected experience:
-
Trailing value/visit – the total engagement value, counting only page views occurring after the visitors encountered the page being tested, divided by the number of visits exposed to the experience.
-
Experience effect – the total negative, positive, or neutral experience effect. This is the difference in percent between the trailing value/visit of the selected experience and the default experience.
The Details panel also shows a preview of the experience. You can click Preview to edit the selected experience.
Example of trailing value for one visit
For example, in one browser session, a visitor does the following:
-
Views a page with a component that is being tested. Variant B of the component is displayed for this visitor.
-
Clicks a link to a page where the visitor downloads a brochure. Downloading the brochure is a goal with a value of 10.
-
Browses to a couple of other pages on the site. These pages have page events associated with them for tracking purposes, but the engagement value assigned to these events is 0.
-
Navigates to a page where the visitor requests a quote. This is a goal with a value of 50.
-
Closes the browser.
The trailing value for variant B for this visit is 60 (10+50).
The trailing value/visit is the average of the trailing value for all visits in which visitors view Variant B of the component.
The Details panel also shows a preview of the experience. You can click Preview to edit the selected experience.
Conversion rate
Conversion rate
The Conversion rate tab shows the conversion rate for all the experiences. Select a goal from the Goal dropdown list to see how many times the goal was triggered. The Rate field expresses the conversion rate for the selected experience as a percentage of the visits in which the selected experience was displayed. If there is more than one conversion per visit, the rate is greater than 100%.
The bar chart lists the experiences in order of their performance measured by conversion rate.
There are two bars for each experience in the test:
-
The first bar shows the relative conversion rate of the experience compared to the best performing experience. The experience with the highest conversion rate is assigned a value of 100. The color of the bar indicates the following:
-
Light gray – the original experience.
-
Green – an experience that performs better than the original experience.
-
Red – an experience that performs worse than the original.
The value of the bar is calculated as follows:
(Conversions per visit for the experience / Conversions per visit of the best performing experience) x 100.
-
-
The second bar shows the relative engagement value of the experience compared to the best performing experience. This bar is always dark gray.
If the goal was not triggered for a variation, the text NO DATA is shown instead of the bars.

When you select an experience in the bar chart, the Details panel shows the conversion rate percentages for the selected experience in addition to the trailing value per visit and the experience effect.
Variables
Variables
The Variables tab shows a graph indicating the engagement value of each variable in the test.
The Details panel shows the trailing value per visit and the experience effect.
Top goals converted
Top goals converted
Expand the Top Goals Converted section to see the goal conversion results for the selected experience.
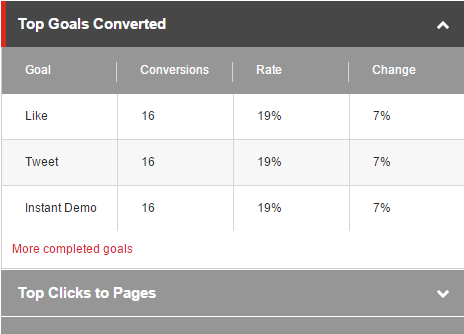
The table shows the following metrics:
-
Goal – the goals triggered by visitors exposed to the test.
-
Conversions – the number of conversions.
-
Rate –the number of goal conversions after viewing the selected experience divided by the number of visits, multiplied by 100.
-
Change – the change between the original experience and the selected experience.
Top clicks to pages
Top clicks to pages
Expand the Top Clicks to Pages section to see the top clicks for the selected experience.
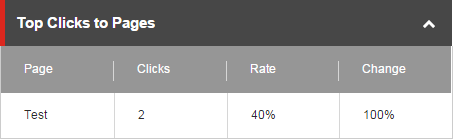
The table shows the following metrics:
-
Page – the name of the next page that was clicked in the session.
-
Clicks – the total number of clicks to the page.
-
Rate – the number of clicks to the page after viewing the selected experience divided by the number of visits, multiplied by 100.
-
Change – the change between the original experience and the selected experience.
Site usage
Site usage
Expand the Site Usage section to see a summary of the site usage for the selected experience.
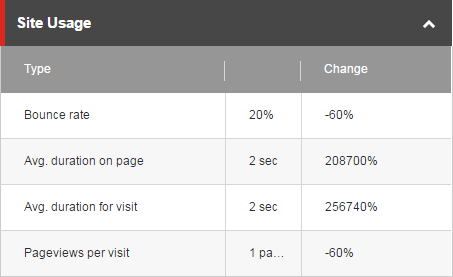
The table shows the following metrics:
-
Type defines the value in the second column:
-
Bounce rate (percent) – the percentage of visitors who visit this page and then leave the site without viewing other pages.
-
Avg. duration on page (number in seconds/minutes) – the average duration that visitors stay on the page.
-
Avg. duration for visit (number in seconds/minutes) – the average duration that visitors stay on the site.
-
Pageviews per visit (number of pageviews) – the average number of different pages that visitors look at in one visit.
-
-
Change shows the change of this measurement compared to the original.
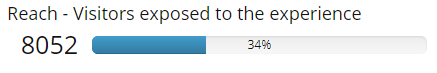
Reach
The Reach section shows the number and the percentage of visitors exposed to this experience.
As described previously, some results are calculated based on the number of visits to the page being tested and this number can differ from the number of visitors, because a visitor can have multiple visits to the same page. The number of visits is not shown in the Test result dialog box.
Test winner
Test winner
The user who has created a test can select an experience in the Test result dialog box and click Pick as winner to end the test and declare the experience as the winner of the test. This overrules the test objective defined for the test. Otherwise, Sitecore finds a winner.
When a test winner has been found, the Test Summary dialog box is displayed.

The Test winner tab includes a preview of the experience that will be the default experience for all visitors who are not targeted by any personalization. The test results also include information about specific visitor segments that respond better to a different experience than the test winner. Click the Personalization suggestions tab to review and apply the suggested personalization rules.
Personalization suggestions
Personalization suggestions
During component tests, Sitecore gathers data and applies Sitecore CortexTM machine learning to determine whether there are segments that respond better to a different experience from the test winner.
The Personalization suggestions tab contains a list of recommended personalization rules for the page. Here you can view and apply suggested personalization rules.

Sitecore displays the Test Summary dialog box without the Personalization suggestions tab if the test is not a component test (for example, it is a basic content test or page test).
To close the Test Summary dialog box without applying any personalization suggestions, click Not now. You can still apply the suggestions later by opening the Personalization suggestions dialog box from the Optimization ribbon.