Monitoring Managed Cloud Standard
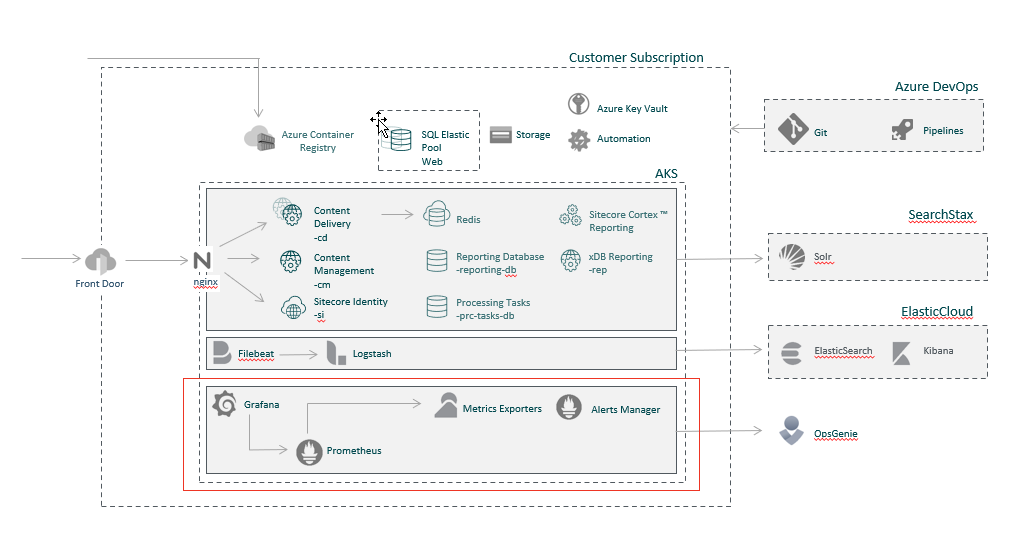
You can stay constantly updated on the performance and availability of your Managed Cloud solution by using the built-in monitoring services:
- Metrics exporters - libraries that help to export metrics from services and infrastructure to an existing Prometheus server.
- Prometheus - scrapes metrics from services, aggregates and stores data, and allows other services such as Grafana to collect such metrics.
- Grafana - collects metrics from Prometheus and visualizes them.
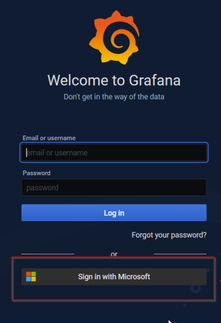
Authentication in Grafana
Grafana is integrated with the Azure Active directory and Basic Authentication is disabled. Therefore, you must choose the Sign in with Microsoft authentication option and use your Microsoft work account.
Dashboards
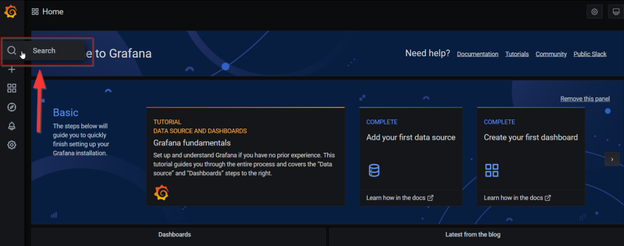
You can search for dashboards by the dashboard name, filtered by one (or many) tags or filtered by starred status. You can access dashboard search through the dashboard picker, available in the dashboard top navigation area. You can also open dashboard search by using the shortcut F.
The following default dashboards are available:
| Dashboard | Description |
|---|---|
| Container overview | Lists all containers with their namespace and pod. Provides the status of each container and the total number of healthy/unhealthy and/or stopped containers. |
| Host Disk Overview (Linux only) | Exposes node filesystem and disk I/O metrics such as read-write time spent, the filesystem available space, and so on. |
| Host Disk Overview (Windows only) | States the filesystem available space. |
| Ingress Overview | Provides the Ingress metrics for each Sitecore role and Grafana. |
| Kubernetes Cluster | Provides a high-level overview of the Kubernetes cluster. |
| Kubernetes Pod Overview | Exposes memory and CPU request, limits, and utilization per pod for all namespaces including system. It provides live logs. |
| Linux Node Overview | Provides detailed information about Memory/CPU/Disk utilization for each Linux Node. |
| MsSql Elastic Pool | Provides detailed information about MsSql Elastic Pool utilization. |
| Redis Server Overview | Exposes general Redis metrics. Similar to native Redis "INFO" command. |
| Windows Node Overview | Provides detailed information about Memory/CPU/Disk utilization for each Windows node. |
Alerts
Alerts proactively notify you when issues are found with your Managed Cloud solution. They allow you to identify and address issues before the users of your system notice them. The following table lists the available alerts:
| Description | Condition | Resource | Period | |
|---|---|---|---|---|
| Node statistic | Memory percentage is >95% | The node memory utilization percentage is more than 95%. | Kubernetes node | 10 minutes |
| CPU percentage is >95% | The CPU load percentage is more than 95%. | Kubernetes node | 10 minutes | |
| Infrastructure | Pod is not ready for 30m | Pod status != ready | Kubernetes pod | 30 minutes |
| Kubelet is down | The kubelet job is down for the last 15 minutes. | Kubernetes job | 15 minutes | |
| Pod is restarting frequently | The Pod is restarted at least once per 5 minutes. | Kubernetes pod | 1 hour | |
| Deployment generation mismatch | The deployment has failed but has not been rolled back. | Kubernetes deployment | 15 minutes | |
| Deployment replicas mismatch | Deployment has not matched the expected number of replicas for longer than an hour. | Kubernetes deployment | 1 hour | |
| DaemonSet pods not ready | Not all of the desired pods are scheduled and ready. | Kubernetes daemonset | 15 minutes | |
| DaemonSet pods not scheduled | Not all of the desired pods are scheduled. | Kubernetes daemonset | 10 minutes | |
| DaemonSet pods misscheduled | Pods of DaemonSet are running where they are not supposed to run. | Kubernetes daemonset | 1 hour | |
| CPU Throttling is high | Pod CPU throttling percentage is more than 25%. | Kubernetes pod | 15 minutes | |
| Warning events occurred | One or more events of type Warning occurred in namespace. | Kubernetes namespace | 1 hour | |
| Node is not ready | The node is not ready. | Kubernetes node | 1 hour | |
| Kubernetes version mismatch | There are different semantic versions of Kubernetes components running. | Kubernetes | 1 hour | |
| Kubernetes API server client is experiencing errors | More than one error in the Kubernetes API server. | Kubernetes | 5 minutes | |
| Node is running out of pods capacity | The node pods capacity is more than 95%. | Kubernetes node | 15 minutes | |
| Disk space is used for >90% | The node disk space is used for more than 90%. | Kubernetes node | 1 hour | |
| Sitecore roles | Http request is 5xx >10 | 5xx http response is more than 10. | nginx_ingress_controller | 10 minutes |
| Average page response time >1 second | The average response time is more than 1 second. | nginx_ingress_controller | 30 minutes | |
| Average page response time >30 seconds | The average response time is more than 30 seconds. | nginx_ingress_controller | 5 minutes | |
Availability tests are on /sitecore/service/keepalive.aspx | The availability tests on /sitecore/service/keepalive.aspx failed. | Sitecore pod | 5 minutes | |
| Redis cache | Average number of connected clients in % are >80% | The number of connected clients is more than 80% compared to redis_config_maxclients. | Redis Cache | 30 minutes |
| The server load is >95% | The processor load percentage for Redis is more than 95% over the last 30 minutes. | Redis Cache | 30 minutes | |
| MSSQL elastic pool | Database throughput unit (DTU) is >95% | The average throughput unit (DTU) is more than 95%. | 30 minutes | |
| Storage percentage is >75% | The average storage percentage is more than 75%. | 5 minutes | ||
| CPU is >95% | The average CPU usage is more than 95%. | 5 minutes | ||
| SQL Databases Deadlock | The database is deadlocked. | |||
| Data IO percentage is >95% | The average Data IO percentage is more than 95%. | 5 minutes | ||
| Log IO percentage is >95% | The average Log IO percentage is more than 95%. | 5 minutes | ||
| Workers percentage is >95% | The maximum workers percentage is more than 95%. | 5 minutes | ||
| Concurrent sessions supported by the DB tier is >95% | The maximum concurrent sessions supported by the DB tier is more than 95%. | 5 minutes | ||
| Number of failed database connections >5 | The database has 5 connection failures over the last 5 minutes. | 5 minutes | ||
| Average In-Memory OLTP storage >95% | The average In-Memory OLTP storage is more than 95%. | 30 minutes |