Request issues
Request issues reports are tabular or pie chart reports on issues related to data requests in your implementation. Each report represents request issues segmented by an issue related criteria.
Request issues by Discover ID, issue type, field name, and field value
These reports are tables of request issues for Discover ID, Issue type, Field name and Field value.
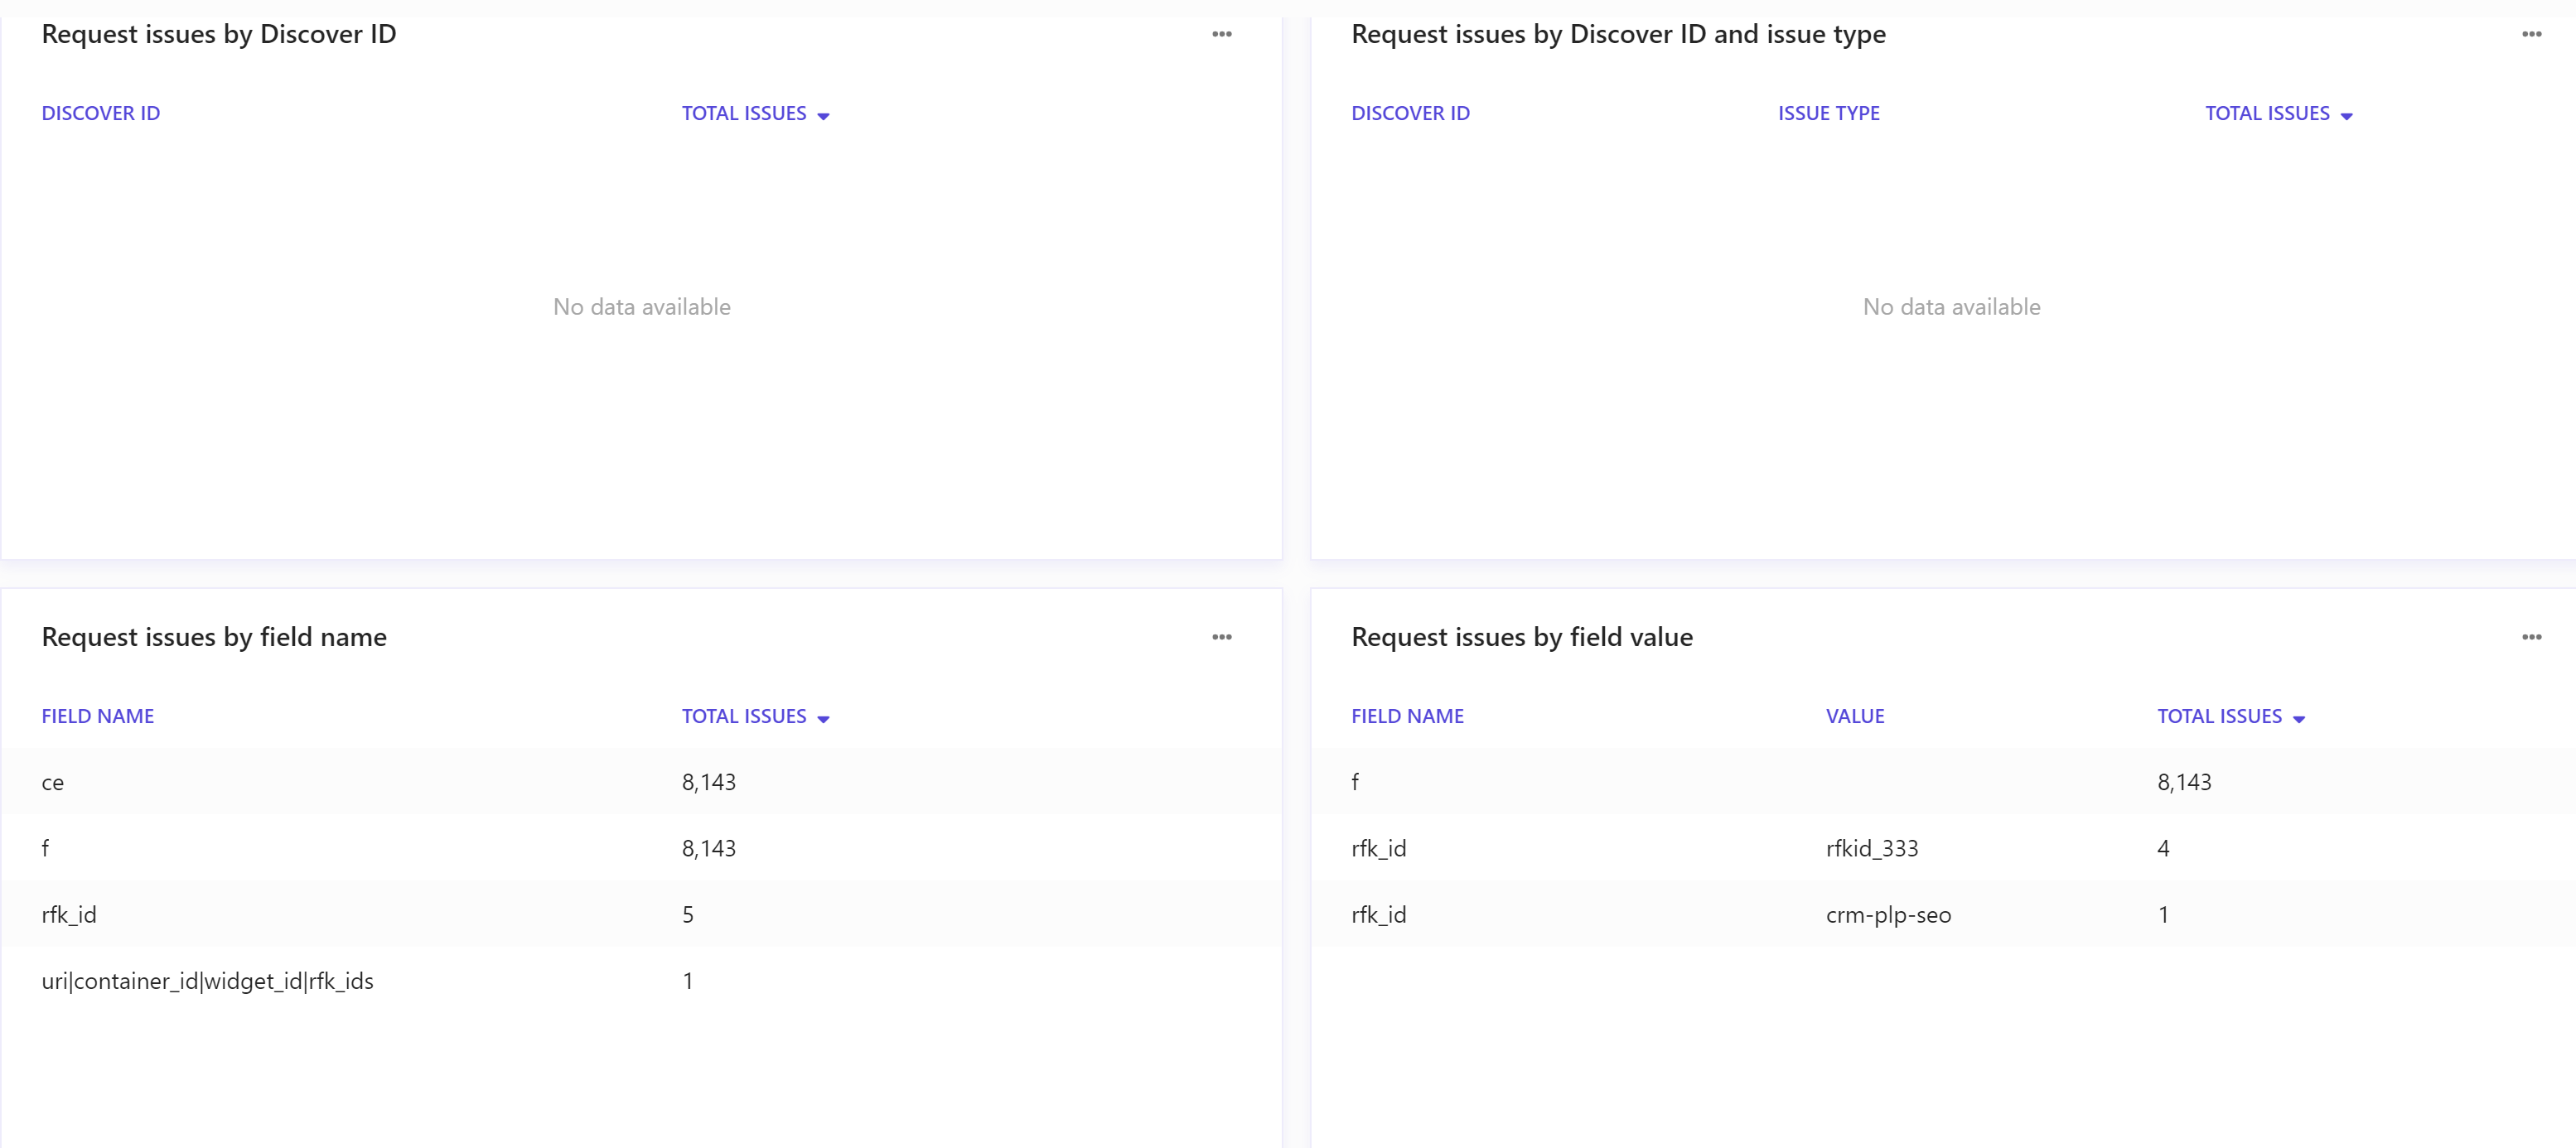
Clicking a row in the table opens a detailed Request issue report.
To examine data points in charts and tables, hover your mouse over the point or element.
To sort the data set, click a column header.
To drill down to a detailed report on an item, click the item.
To export data, click  and then click Export Data.
Request issues by severity and device
These reports are pie chart visualizations of request issues grouped for severity and device.

To examine data points in charts and tables, hover your mouse over the point or element.
To export data, click and then click Export Data.
Data filters
Use the following filters to generate data for this report:
Date range - includes Yesterday, Last 7 days, Last 14 days, Last 30 days, Last 90 days, and Customized range.
Devices - includes Desktop, Tablet, Mobile, and Bot.
Issue type - includes Field value is missing and other issue types.
Events - includes All events, Widget click, Widget view, Add to cart, and Order confirmed.
Field - includes all available fields. Default is All fields.
Severity - includes All severity and High.
Metrics and KPIs
These reports present the following metric:
Total issues - the total number of issues encountered.