Overall Discover attribution
The Overall Discover attribution report provides details on the impact that Discover has on the overall performance of your site over the selected time period.
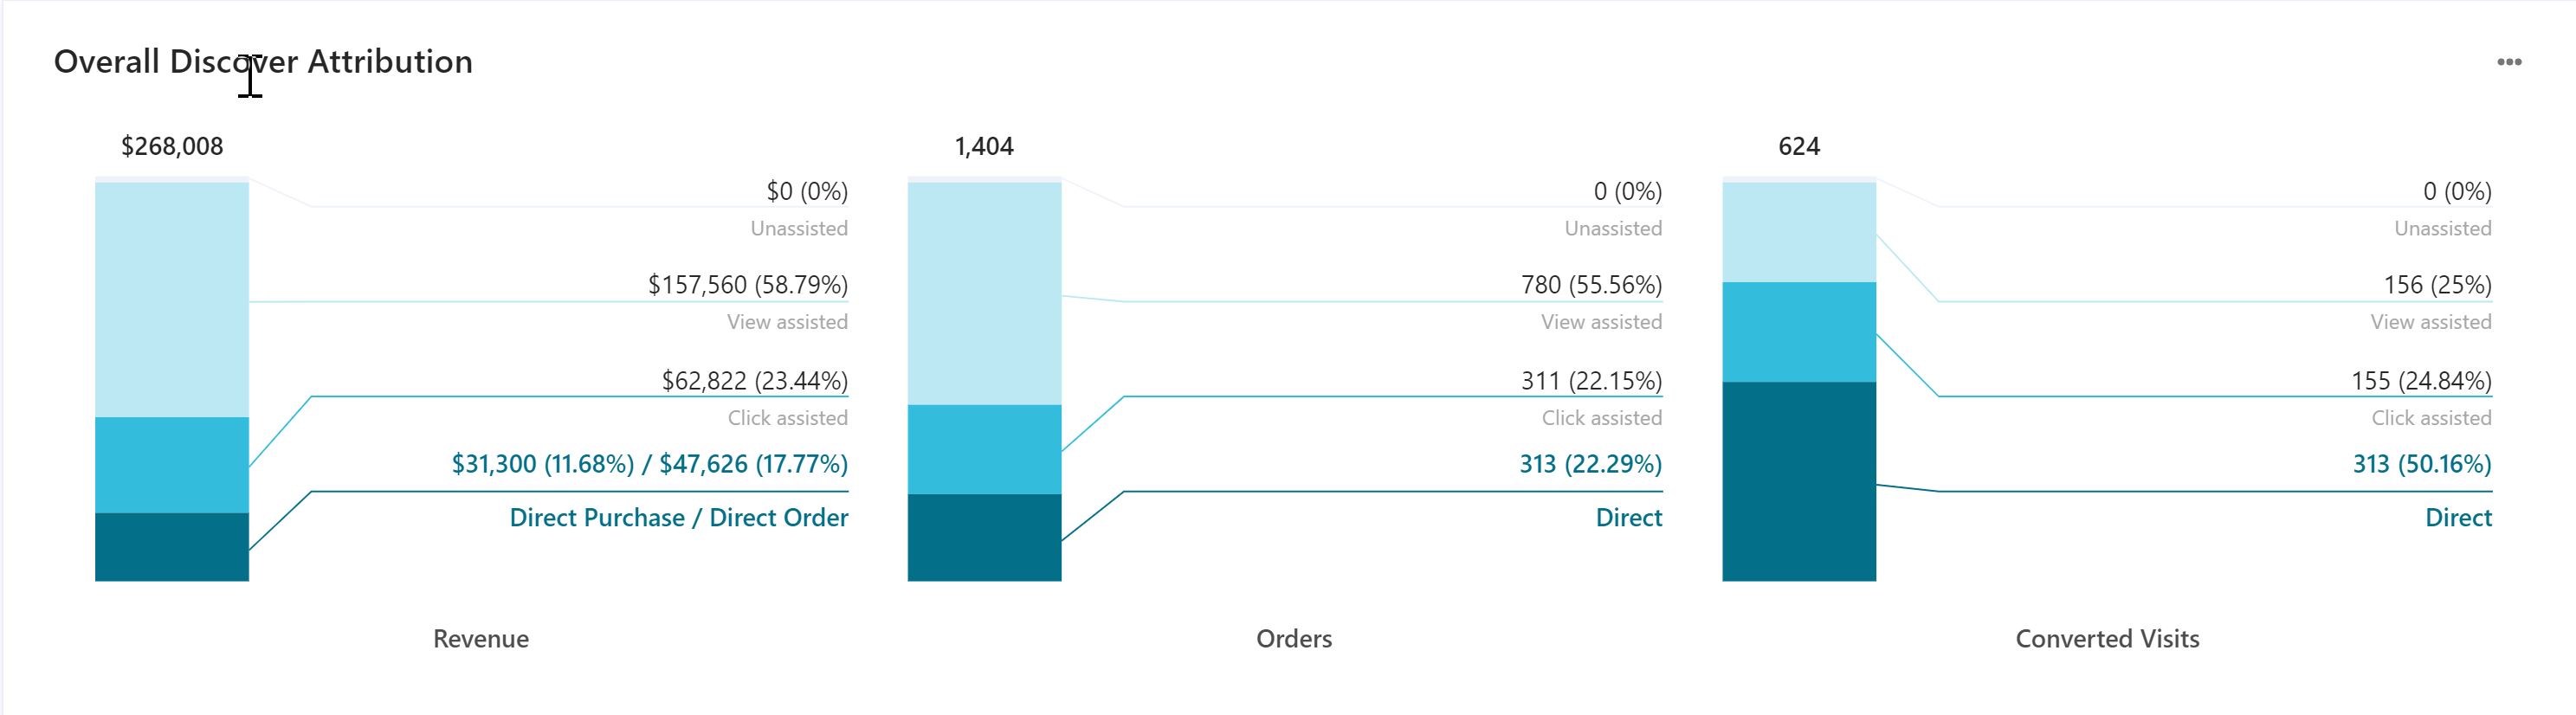
These cumulative bar charts provide a clear picture of the impact of Discover on your bottom line for the selected time period.
If the total revenue and orders are more than 10% above or below the number tracked by your BI tool, contact your Sitecore customer representative.
Data filters
You can narrow down the data you see in reports using the filters at the top of the report dashboard or section. Changing these values regenerates the reports.
Use the following filters to generate data for this report:
Date range - includes Yesterday, Last 7 days, Last 14 days, Last 30 days, Last 90 days, and Customized range.
Devices - includes Desktop, Tablet, Mobile, and Bot.
App type - includes Web, Native, and Webview.
Country - includes a list of countries.
Visitor type - includes new and returning visitors.
Channel - includes different methods by which a visitor has accessed your website or mobile app.
Locale - includes a list of locales.
Depending on your domain setup, you might see some or all of these filters.
Metrics and KPIs
In the reports, attributed metrics and KPIs represent records that reflect the type of visitor interaction to which they are attributed.
For example, a click-assisted metric records sessions or visits where the visitor purchased one or more products different from those that they clicked.
Visitor interaction types include:
- Direct - refers to a visitor clicking one or more products and purchasing one or more products that they clicked.
- Click-assisted - refers to a visitor purchasing one or more products different from those they clicked.
- View-assisted - refers to a visitor viewing one or more products.
- Unassisted - refers to a visitor not viewing and not clicking a product but converting.
The following describes the metrics and KPIs in this report:
Revenue attribution
For revenue, attributions are displayed in the following metrics:
Direct order revenue - the revenue from sessions where a visitor clicked one or more products and purchased one or more products they clicked. The entire order (basket) revenue is included in this metric. This metric is sometimes called Direct revenue.
Click revenue - the revenue from sessions or visits when a visitor purchased one or more products different from those clicked.
View revenue - the revenue from sessions or visits where a visitor viewed one or more products.
Unassisted Revenue - the revenue from sessions or visits where the visitor did not view and click a product but converted.
Order attribution
For orders, attributions are displayed in the following metrics:
Direct orders - the number of orders from sessions where a visitor clicked one or more products and purchased one or more products they clicked.
Click-assisted orders - the number of orders from sessions or visits when a visitor purchased one or more products different from those clicked.
View orders - the number of orders from sessions or visits where a visitor viewed one or more products.
Unassisted orders - the number of orders where the visitor did not view and therefore did not click a widget, but did convert.
Converted visit attribution
For converted visits, attributions are displayed in the following metrics:
Direct converted visits (CVT) - the number of visits that ended in a conversion action from sessions where a visitor clicked one or more products and purchased one or more products they clicked.
Click converted visits (CVT) - the number of click-assisted converted visits.
View converted visits (CVT) - the number of view-assisted converted visits.
Unassisted CVT visits - the number of unassisted converted visits.