Top domains
The Top domains reports for revenue and visits are bar chart reports over a selected time period. The bar displays revenue or visits of each domain.
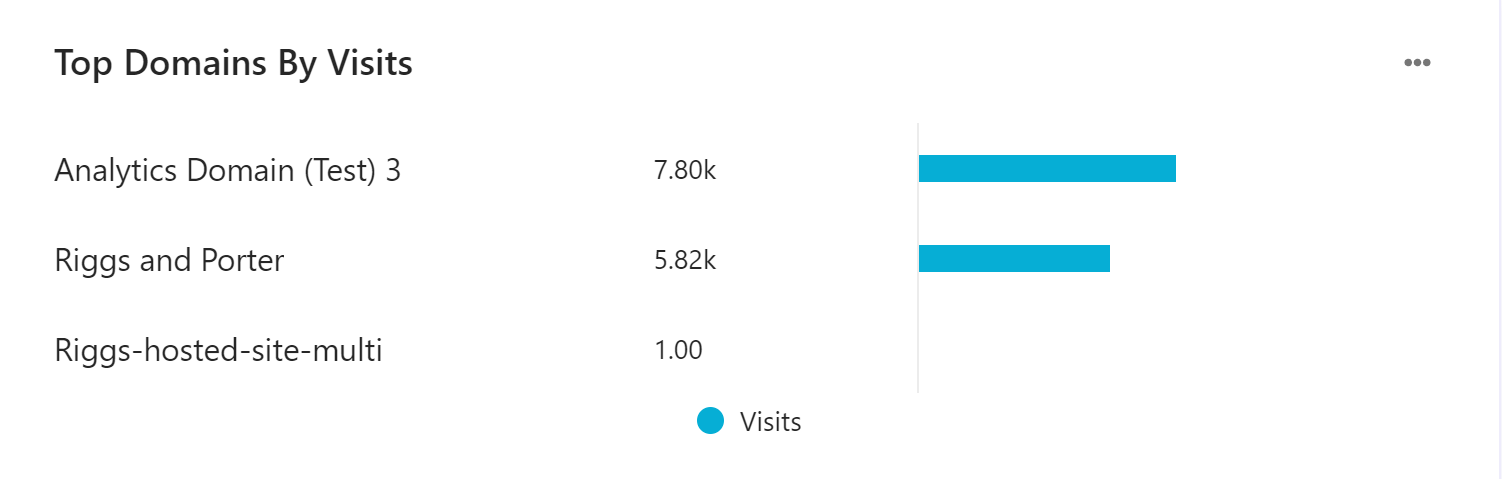
To examine data points in charts and tables, hover your mouse over the point or element.
To export data, click  and then click Export Data.
Data filters
You can narrow down the data you see in reports using the filters at the top of the report dashboard or section. Changing these values regenerates the reports.
Use the following filters to generate data for this report:
Date range - includes Yesterday, Last 7 days, Last 14 days, Last 30 days, Last 90 days, and Customized range.
Devices - includes Desktop, Tablet, Mobile, and Bot.
App type - includes Web, Native, and Webview.
Country - includes a list of countries.
Visitor type - includes new and returning visitors.
Channel - includes different methods by which a visitor has accessed your website or mobile app.
Locale - includes a list of locales.
Depending on your domain setup, you might see some or all of these filters.
Metrics and KPIs
The following describes the metrics and KPIs in this report:
Visits - the total number of visits.