View operational data for an experiment in Sitecore Personalize
After your experiment is live, you view how it is executing on the Operational screen. You can see successful and failed executions, along with the executions average duration and the number of events being raised against the primary goal. The operational metrics are updated every 15 seconds.
Metrics for the goal display on the dashboard after the user's session closes. The session close can occur when a user manually closes the session or when the platform automatically closes the session after a certain period of inactivity. This is configured differently by each organization, for each tenant.
Additionally, when the experiment is live, you can view how the variants are performing against each other within 24 hours in the Performance screen.
For web and interactive experiments, you can also view the A/B Test Analysis report for exploring test metrics such as average session duration, views, and searches.
To view operational data:
-
On the navigation menu, click Experiments. The experiment list displays.
-
To view experiments by status, click the Live, Paused, or Completed tab. To refine the list further, click Web, Interactive, or Triggered to display experiments by type.
-
Click the name of the experiment you want to view.
-
Click the Operational data menu item. The Operational screen displays:
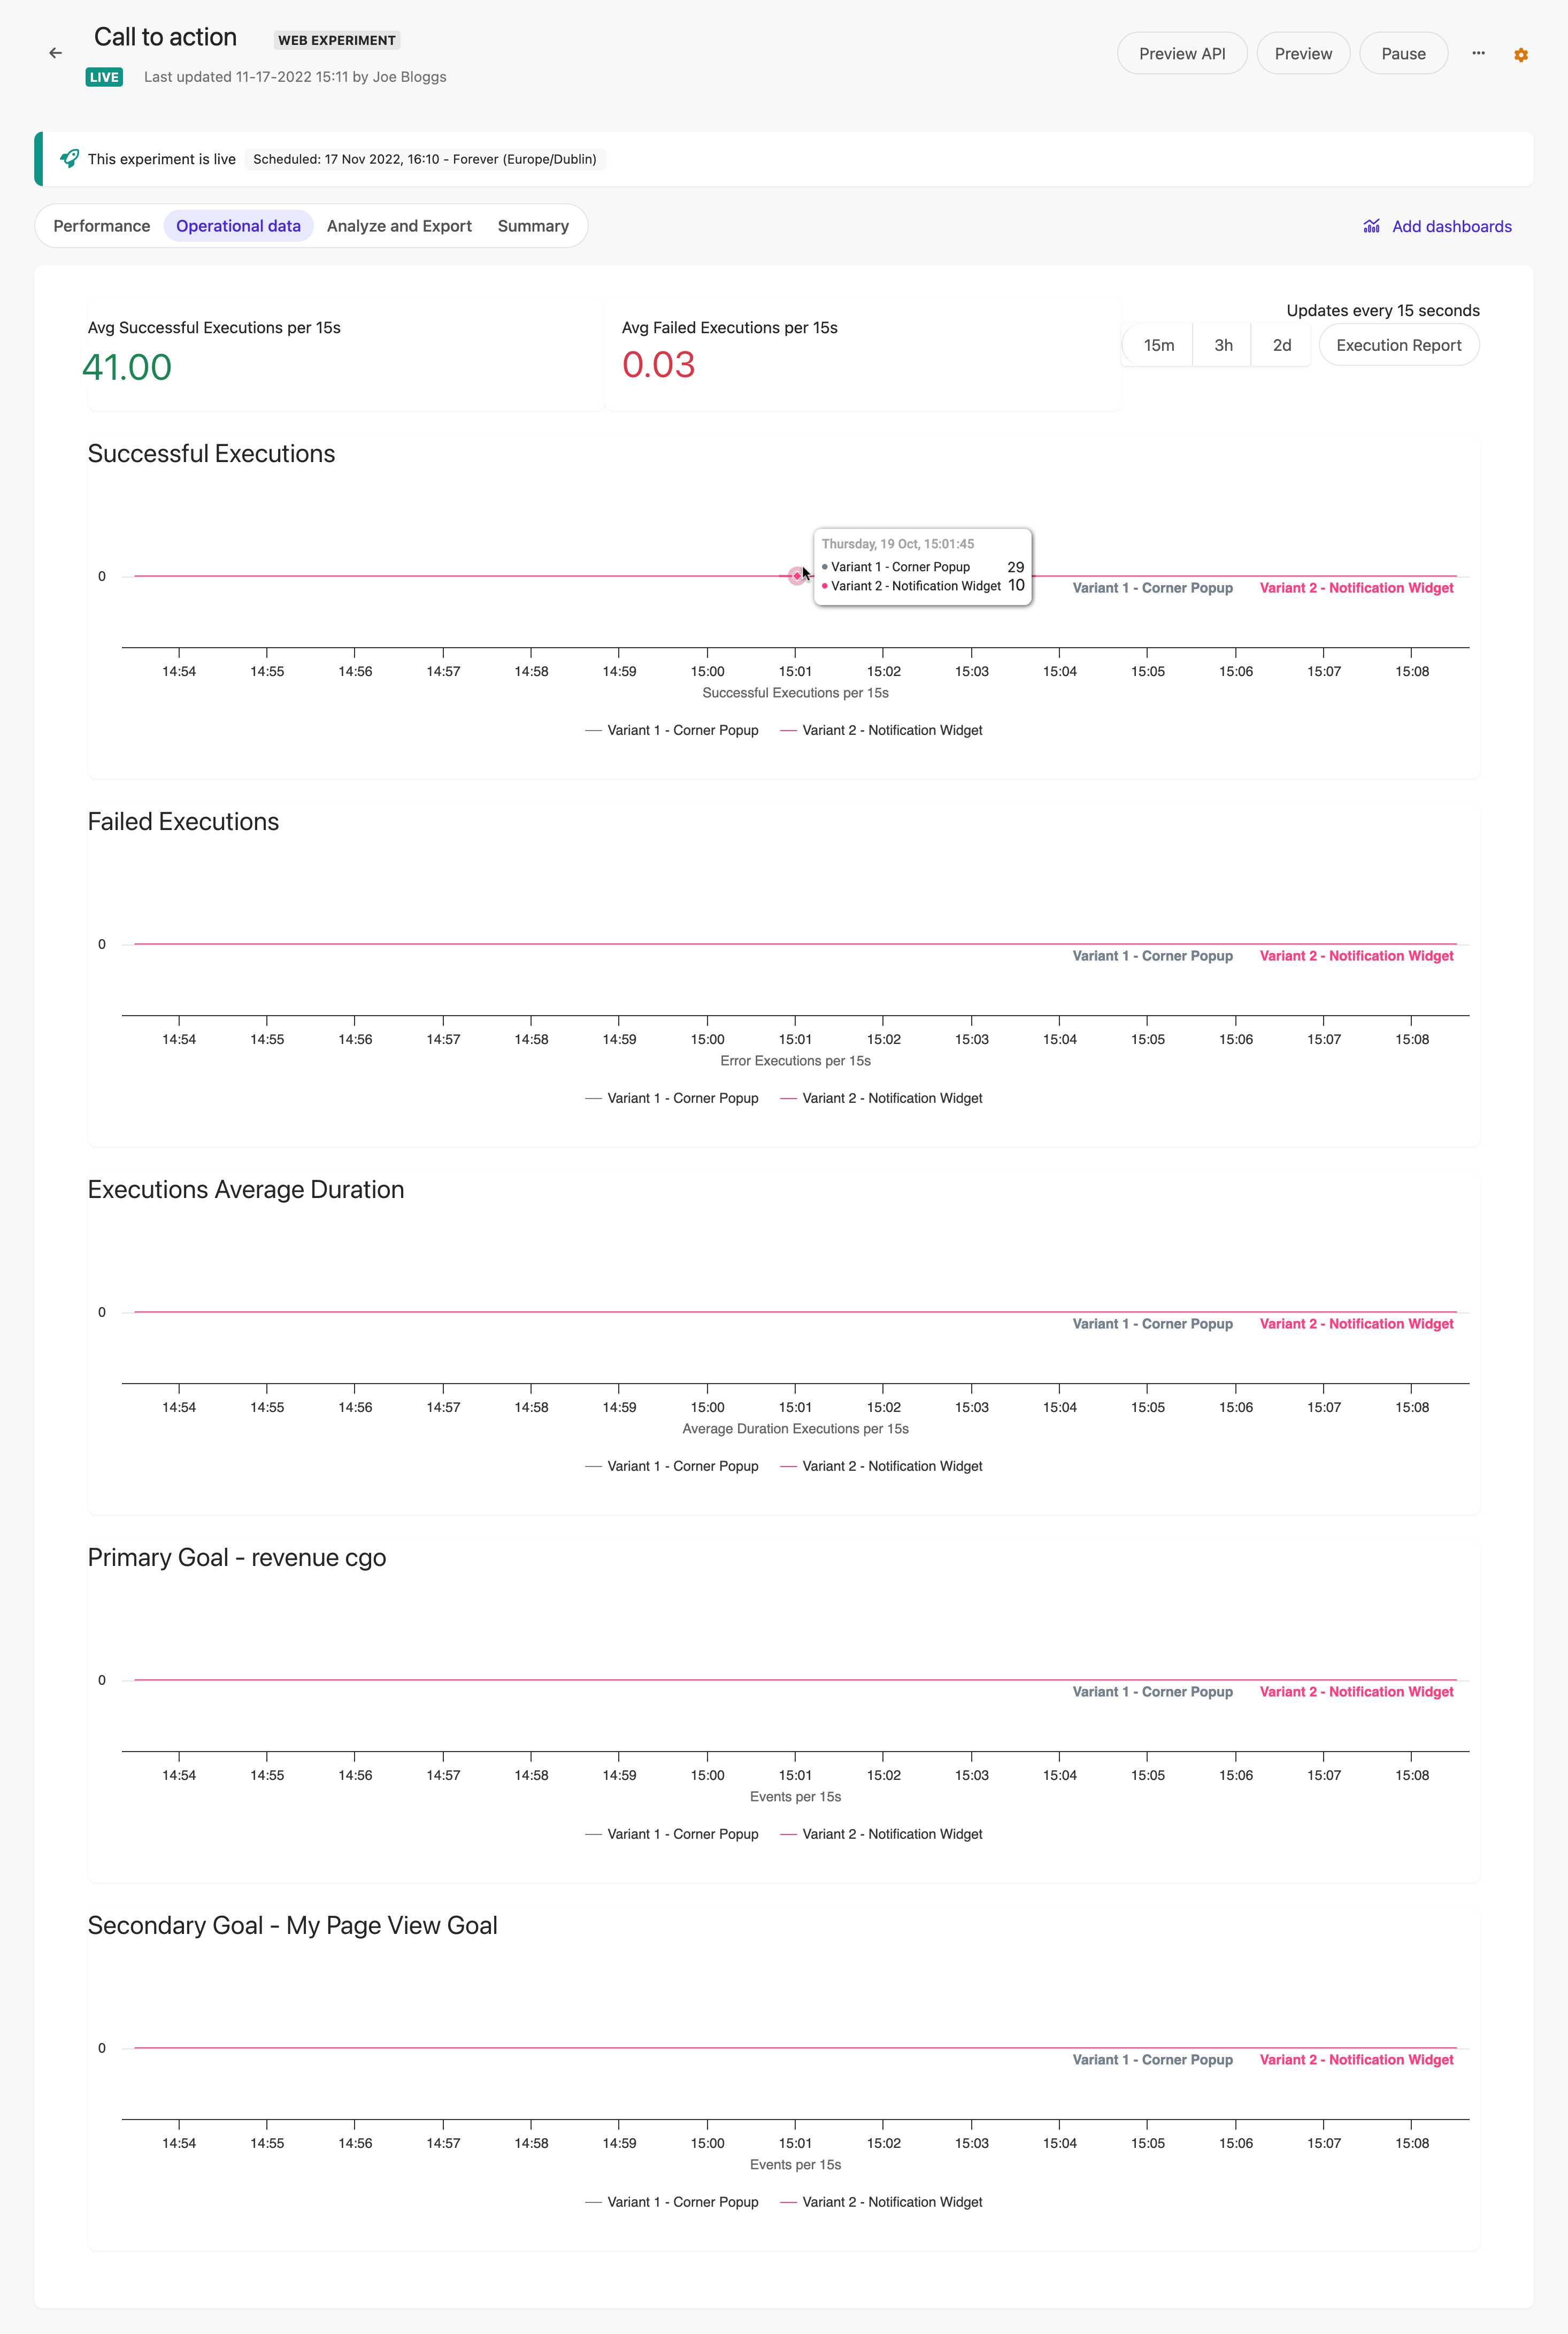
This table contains a description of each screen item at the top of the Operational data screen.
| Screen item | Description |
|---|---|
| Name | This displays the proper name of the experiment or which you are viewing performance analytics. A Web, Interactive, or Triggered caption displays beside the name. |
| Status and Last updated details | The current status of the experiment, and the date, timestamp, and user who last updated the experiment. The current status affects the Status change button, as detailed in the row below. |
| Start or Pause button | If the experiment has a live status, a Pause button displays. If the experiment has a draft or paused status, a Start button displays. |
| Preview or Test button | Click the Preview button to test and preview a web experiment. The Test button only displays for interactive experiment. To test and configure the API response for an interactive experiment, click Test. |
| Vertical ellipsis | Click to duplicate, delete, or view the history of the experiment. |
| Status and schedule banner | The status of the experiment and duration it's scheduled to run. |
| Performance | Click to view performance analytics for the experiment. Performance analytics are available 24 hours after an experiment is started. |
| Operational data | Displays operational metrics for the experiment. |
| Summary | Click to view details of the experiment including when it was created and who created it. |
| Analyze & Export | Click to see an in-depth, day-by-day analysis of variant performance that you can download. |
| Add dashboards | Click to view various analytics dashboards to better understand performance. This option is available to customers who have Sitecore Customer Data Platform (CDP) in addition to Sitecore Personalize. |
This table contains a description of the metrics on the Operational data screen.
| Screen item | Description |
|---|---|
| Avg Successful Executions per 15s | This displays the average number of successful executions per 15 seconds. This is a decimal percentage. |
| Avg Failed Executions per 15s | This displays the average number of failed executions per 15 seconds. This is a decimal percentage. |
| Time Duration Setting | To change the time duration that displays on the x axis of the timelines, select the required duration button: 15m: Click to set the time duration on the timeline to 15 minutes. This is the default setting. 3h: Click to set the time duration on the timeline to 3 hours. 2d: Click to set the time duration on the timeline to 2 days. |
| Execution Report | Click this button to view an execution report. You can also save the report to .pdf format. |
| Successful Executions | The number of successful executions for each variant, per the time duration button you selected; 15m, 3h, or 2d. To see this data on the timeline, hover your mouse over any lines on the timeline. An information callout displays. |
| Failed Executions | The number of failed executions for each variant, per the time duration button you selected; 15m, 3h, or 2d. To see this data on the timeline, hover your mouse over any lines on the timeline. An information callout displays. |
| Executions Average Duration | The average number of executions for each variant, per the time duration button you selected; 15m, 3h, or 2d. To see this data on the timeline, hover your mouse over any lines on the timeline. An information callout displays. |
| Primary Goal | Displays data on the timeline for the Primary Goal of the experiment. To see data for the primary goal on the timeline, hover your mouse over any lines on the timeline. An information callout displays. |