Report dashboards
Dashboards present a visual representation of Sitecore Search analytics reports, giving you the information and insights you need to better understand how your site is searched and how it performs.
You'll find various reports on the Analytics page by expanding a section in the left pane and clicking the report type you want to view. This displays a report dashboard that contains a composition of different report types on a keyword, page, widget, or component. For some types of reports, such as tabular reports, you can drill down on the data for a more detailed look at the metrics and KPIs.
The Site Performance report is the homepage for Sitecore Search and accessible by clicking Site Performance  on the menu bar. It contains the following engagement reports on the performance of widgets for the selected period:
- The Overall Engagement report provides information on all interactions with the site, pages, and widgets.
- The Preview Search Engagement report provides information on the performance of preview search widgets.
- The Search Page Engagement report provides information on the performance of search result widgets.
- The Recommendation Engagement report provides information on the performance of recommendation widgets.
Reports available on the Analytics page are grouped into the following sections.
| Section | Reports available | Description |
|---|---|---|
| Customized Reports | Saved reports | Reports where you have applied filters and then saved the report. |
| Site > Widgets | Overview Preview Search Search HTML Block Widget Explorer | Reports that show data on performance, engagement, and keywords of widgets over a selected time period. Performance is reported overall and by widget type. The Overview report provides an overview for all active widgets. |
| Site > Keywords | Overview Keywords Explorer Widget type | Reports that show data on performance and engagement in context of keywords used by visitors in preview search and search results widgets. The Overview report provides an overview of the performance of all keywords used by visitors. |
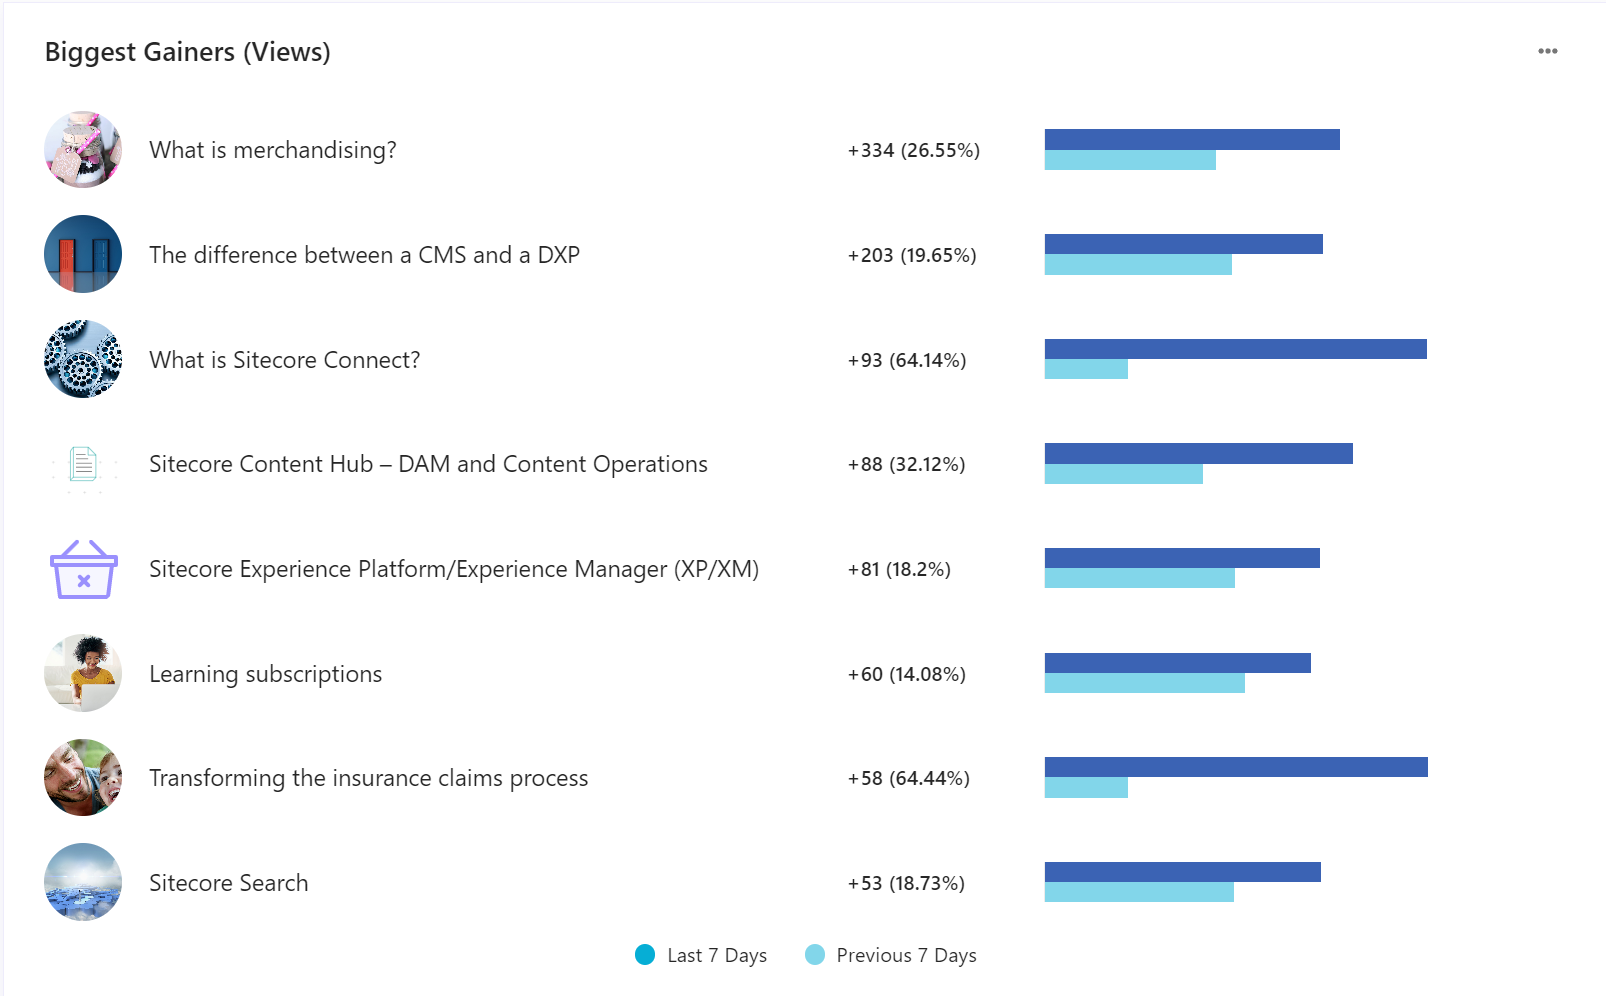
| Documents | Overview Documents Explorer | Reports that show data on engagement in the context of documents viewed by visitors over a selected time period. It shows the top documents by view or by click conversion, as well as the biggest gainers and decliners in terms of views and click conversions over the time period. |
| Split tests | Split test overview Split test winner Split test results Split test results over time Primary testing metrics results Additional metric results Split tested widget purchase funnel Audience metrics | Reports that show an overview of split tests for each widget and performance metrics for each split test. For example, the start and end dates, traffic split, the variations tested, as well as default widget KPIs. These metrics help marketers evaluate the effectiveness of different variations and adjust traffic or make an informed decision about which variation to set as default. |
| Sources | Overview | Reports that show data about your indexed sources, such as the number of items indexed or dropped and the average index time. The Overview report allows you to compare metrics across sources and see a comparative table of source details, such as index frequency or if the last run finished or failed. |
| Commerce | Overview Widget Explorer Preview Search | Reports that show commerce-specific data about your product catalog based on customer events. This can be used to understand how users interact with different types of searchable content, compare the impact of merchandising strategies, and evaluate performance across stores, customer groups, or product variations. |