Data quality chart
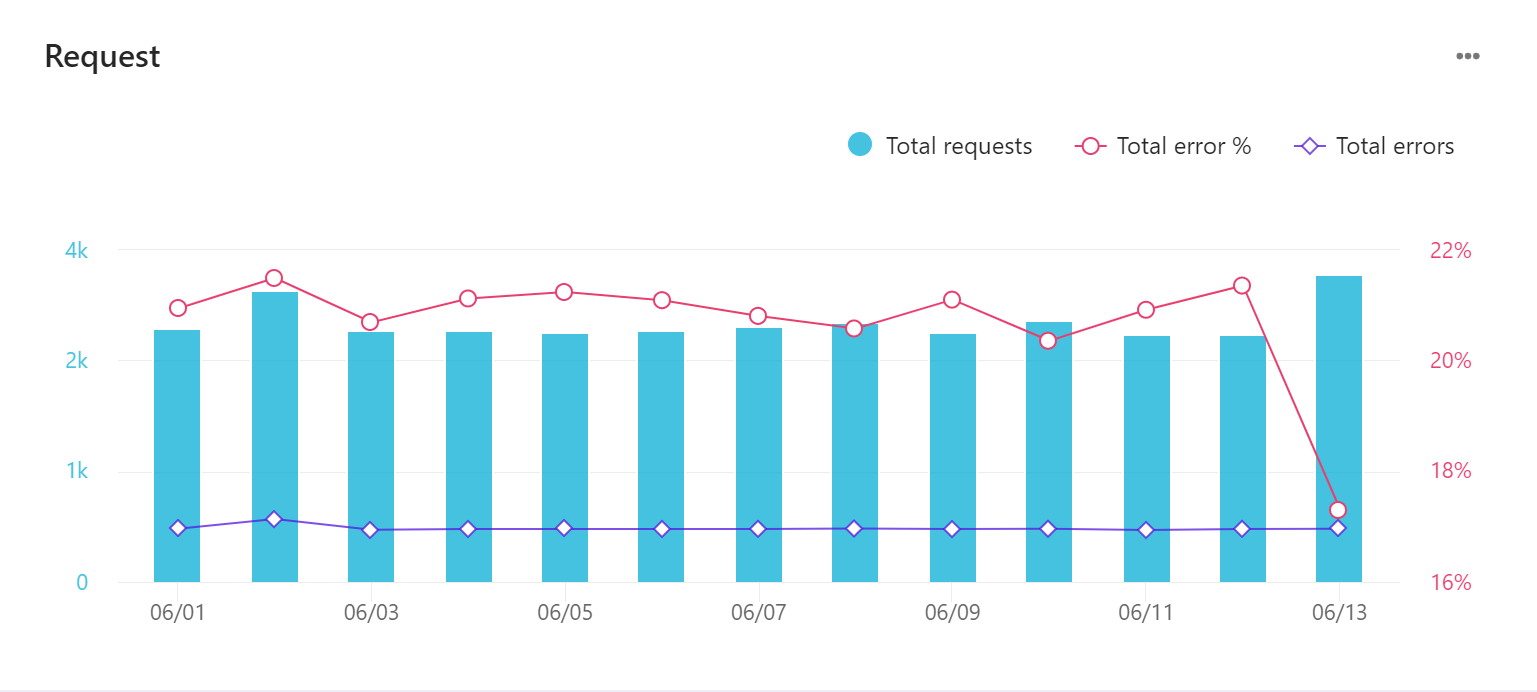
The Data quality chart report is a timeline chart in the Overview section in Data Quality. Bars plot total metrics and lines plot total errors and total error percentage. You can click a data point to open a detailed report for that specific date with other data filters persisting.
These reports are available for requests, events, and product feeds. The following is a typical data quality chart:
To examine data points in charts and tables, hover your mouse over the point or element.
To export data, click  and then click Export Data.
Metrics and KPIs
This report uses the following metrics and properties:
Total requests - the total number of requests for search and recommendation.
Total events - the total number of user interaction events sent to track with Discover.
Avg. records processed - the average of processed records from all data runs within a period.
Avg. records rejected - the average of rejected records from all data runs within a period.
Total errors - the total number of search and recommendation request or calls for event tracking that resulted in errors.
Total error percentage - the ratio of total errors to total requests or total errors to total events.