Data quality summary
The Data quality summary reports are tabular lists of all active widget events, requests, events, and product feed runs over a selected time period.
These reports are available for widget events, request issues, event errors, and product feeds. The following is a typical data quality summary report:
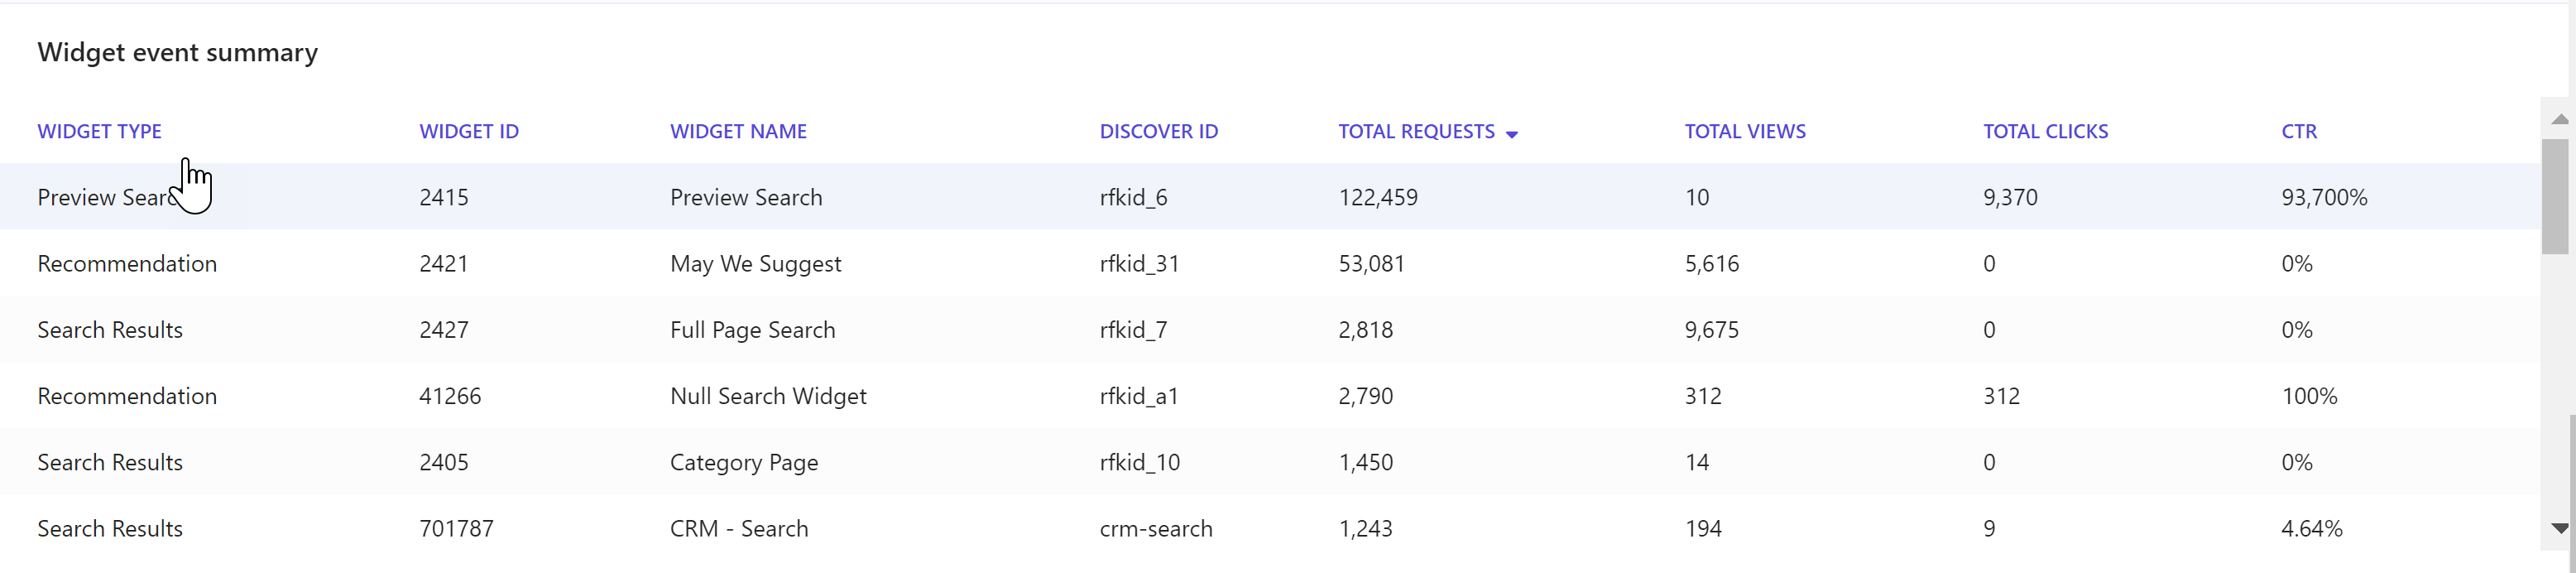
To examine data points in charts and tables, hover your mouse over the point or element.
To sort the data set, click a column header.
To export data, click  and then click Export Data.
Metrics and KPIs
This report uses the following metrics and properties:
Total clicks - the total number of clicks on a widget or a group of widgets.
Total views - the total number of views of a widget, page, group of widgets, or group of pages.
Click through rate - the ratio of visitors who clicked a widget after having viewed one.
Total requests - the total number of requests for search and recommendation.
Total events - the total number of user interaction events sent to track with Discover.
Total errors - the total number of search and recommendation request or calls for event tracking that resulted in errors.
Total error percentage - the ratio of total errors to total requests or total errors to total events.
Rejected percentage - the ratio of rejected records and total processed records.