Feed issues
Feed issues reports are tabular or pie chart reports on issues related to data feed runs. Each report represents feed issues segmented by field name, severity or value.
The following three reports inform on the feed issues encountered:
- Feed issues by field name lists feed issues and totals grouped by field name.
- Feed issues by field severity is a pie chart of feed issues grouped by severity.
- Feed issues by field value lists feed issues and totals grouped by field value.
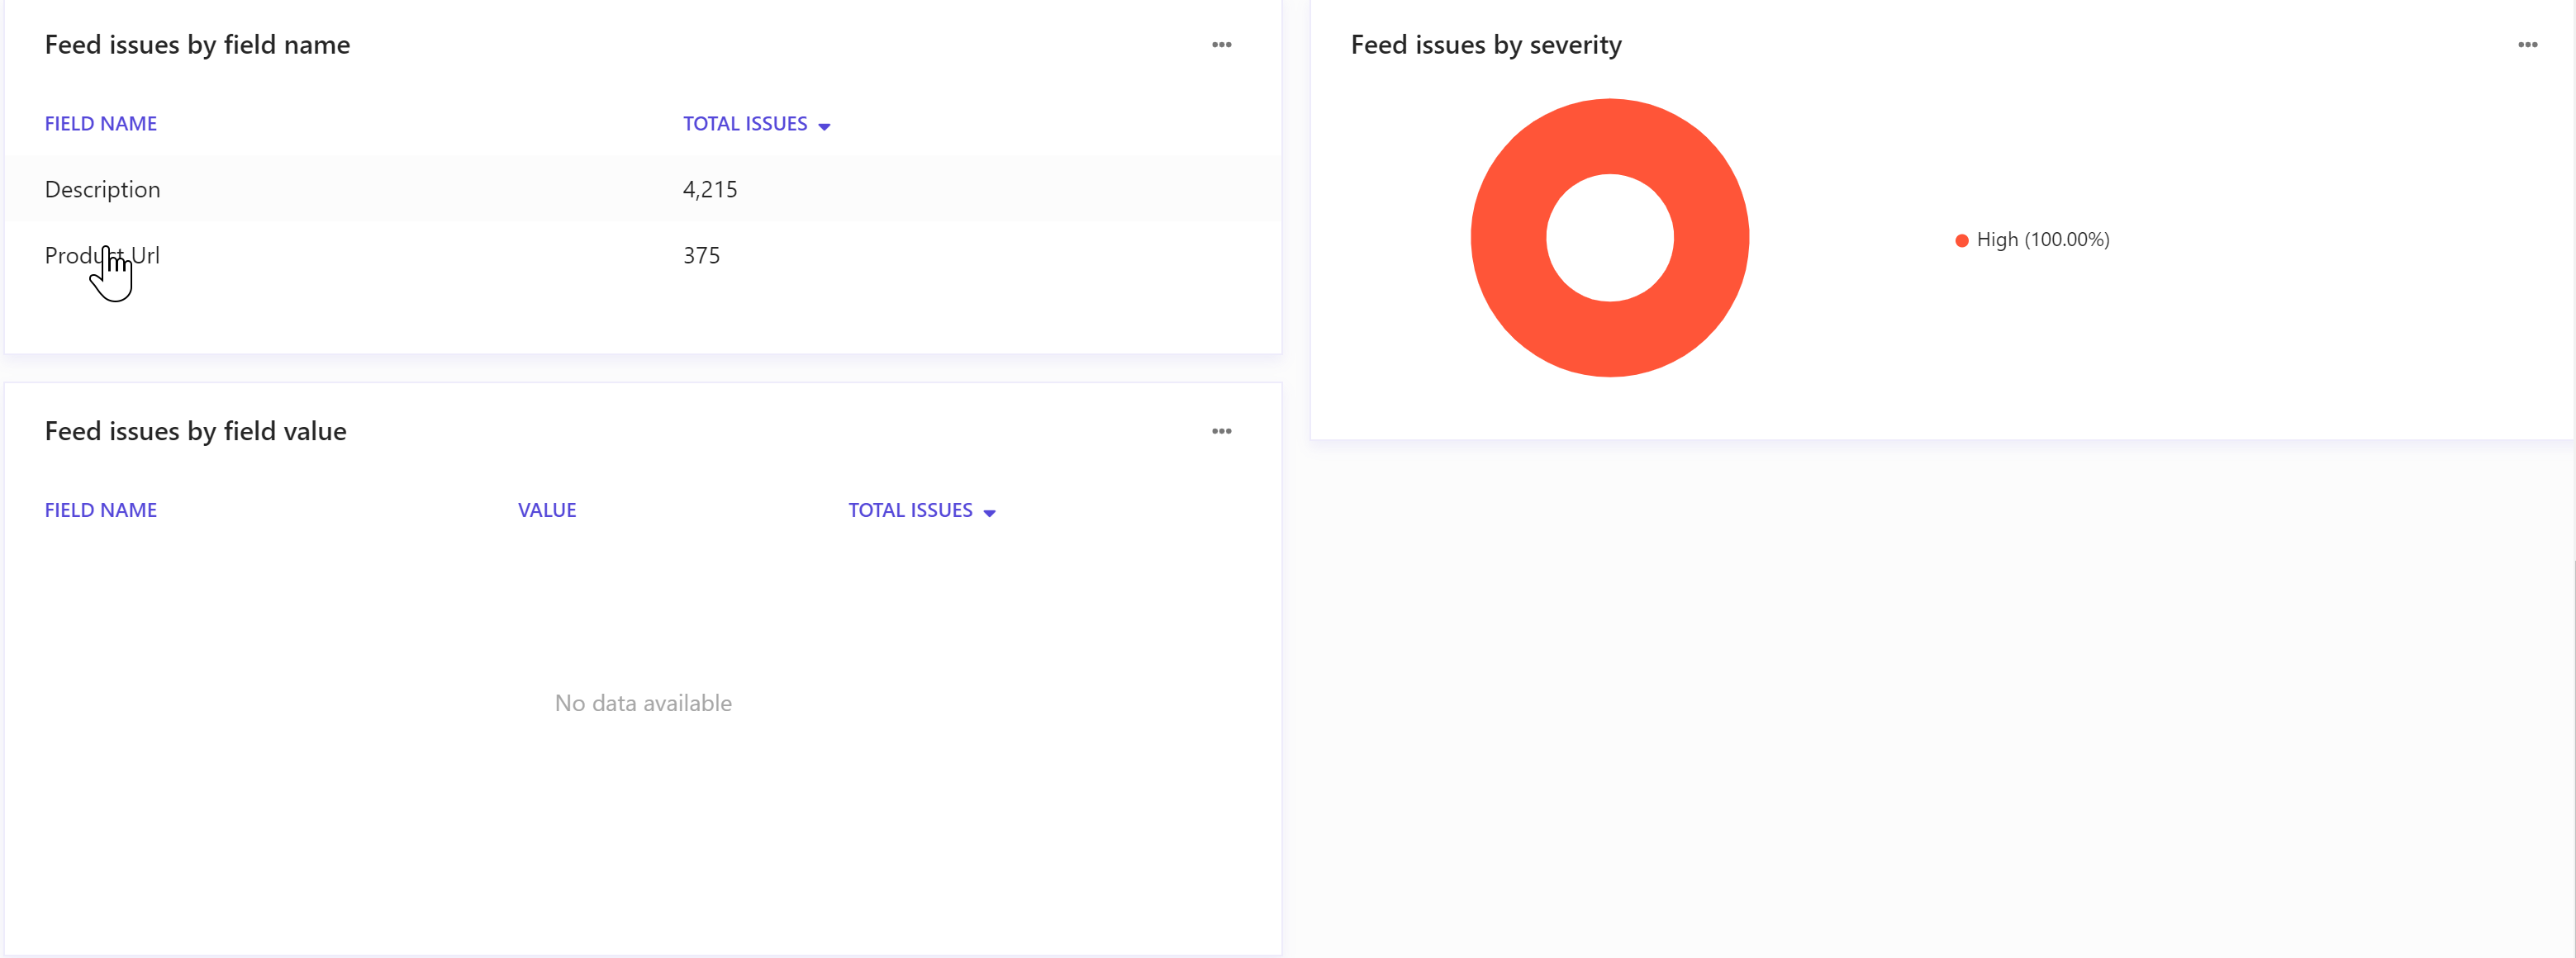
Clicking a feed issue in Feed issues by field name or Feed issues by field value opens a Feed issue report filtered for the field name or field value respectively.
Data filters
Use the following filters to generate data for this report:
Date range - includes Yesterday, Last 7 days, Last 14 days, Last 30 days, Last 90 days, and Customized range.
Jobs - allows users to select jobs by ID.
Field - includes all available fields. Default is All fields.
Severity - includes All severity and High.
Metrics and KPIs
This report uses the following metrics and properties:
Total issues - the total number of issues encountered.
Over populated entries - the total number of entries that are over populated.
Field type is missing - the total number of cases where a field type is missing in the data feed.