
Insights across public apps
On the Cloud Portal > App studio > Insights page, the Public apps usage insights dashboard provides an overview of public Marketplace apps created by your organization. It shows how many apps are in each status. The dashboard also summarizes installations, active organizations, and uninstallations across your published public apps.
These insights help you identify high-performing apps, apps with low engagement, and apps with a high uninstallation rate that may need investigation.
Performance metrics are based on installation, app-opening, and uninstallation activity across Sitecore organizations using your published public apps.
Each app developer's own installations, app openings, and uninstallations are excluded from the performance metrics. Activity by other team members in the developer's organization is included.
Data refreshes daily.
Open the dashboard
To open the Public apps usage insights dashboard, in the Cloud Portal, click App studio > Insights.
View apps by status
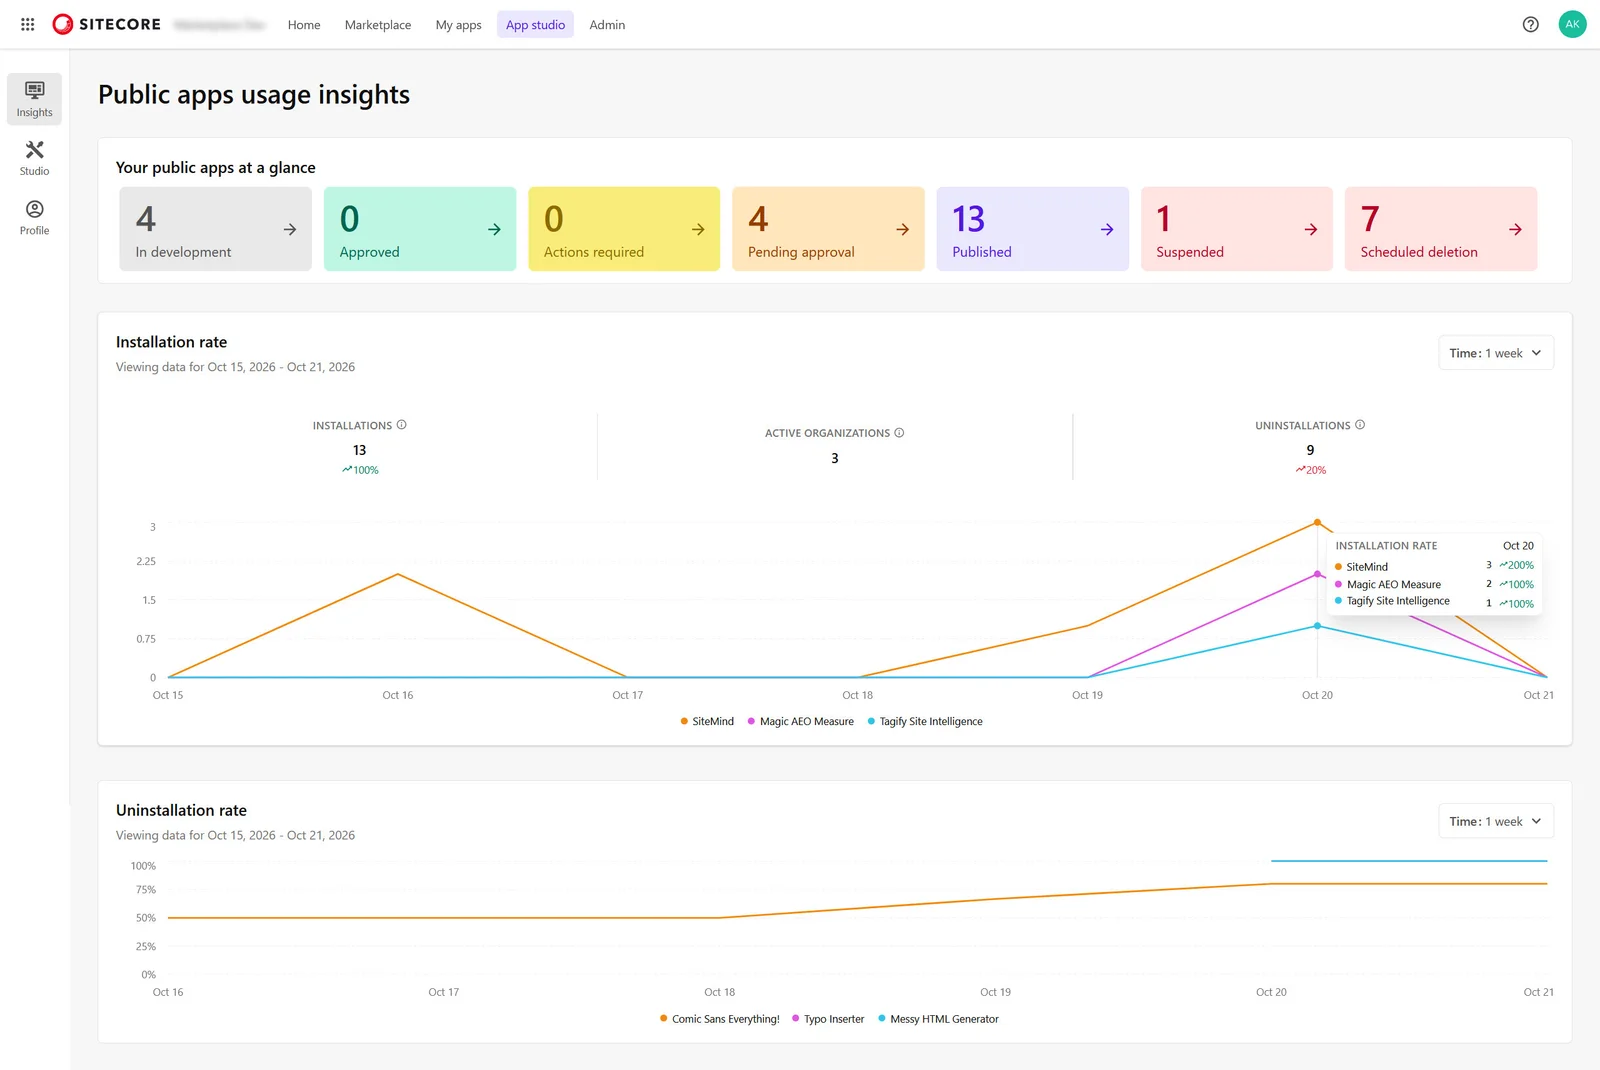
The Your public apps at a glance section shows the number of your organization's public apps in each status.
To view your public apps in a certain status, click its card. The Studio page opens and displays your public apps in that status.
Filter data
In each report, use the Time selector to choose the period to review:
- 1 day
- 1 week - the default selection.
- 1 month
- All time
Data for the selected period appears in the report. The exact date range appears under the report title.
For the graphs, the selected period changes only the dates displayed. The rates are calculated using data from the app's lifetime up to each date shown.
Installation rate
The Installation rate report includes the following metrics for the selected period:
- Installations - the number of times your public apps were installed across Sitecore organizations. Each public app installation is counted once per organization, even if it installed that app multiple times.
- Active organizations - the number of organizations that opened your apps at least once in any of the app's extension points.
- Uninstallations - the number of times your public apps were uninstalled across Sitecore organizations. Each public app uninstallation is counted once per organization, even if it uninstalled that app multiple times.
These metrics cover all your published public apps. Green or red trend indicators next to each metric show the daily change.
The Installation rate graph shows installation activity over time for the three most installed published public apps during the selected period. Use it to compare adoption trends across these apps. Each line represents an app. Hover over a data point to view values for a specific date.
Uninstallation rate
The Uninstallation rate graph shows uninstallation rates over time for the three most uninstalled published public apps during the selected period. Use the graph to identify apps that may need investigation.
Uninstallation rate is the percentage of organizations that installed the app and uninstalled it at least once.
Calculation: (organizations that uninstalled the app ÷ organizations that installed the app) × 100
For each date shown, the calculation includes all installations and uninstallations since the app was first published. Each organization is counted once, even if it installed or uninstalled the app multiple times. The selected period changes only the dates displayed, not the counts used in the calculation.
Interpreting dashboard values
Compare metrics over time and across apps before deciding what to investigate.
| Metric | Signals to investigate | Recommended steps |
|---|---|---|
| Installations | Fewer installations could indicate reduced discovery or limited interest. |
|
| Active organizations | Installation activity without corresponding app usage could indicate difficulty getting started. | Review your app's onboarding materials, screenshots, documentation, and configuration requirements, and the steps needed to open and use your apps. |
| Uninstallations | Increasing uninstallations could indicate unmet expectations or quality issues. | Review customer feedback and recent app changes, then investigate affected apps individually. |
To investigate an individual app's discovery, activation, and engagement in detail, open its Analytics tab.