Personalization insights dashboard
The Personalization insights dashboard provides a centralized, site-wide view of how personalization experiences are delivered. Use it to track personalization reach, default experience delivery, delivery errors, delivery performance, and activity across channels and languages, so you can identify delivery issues and experiences that aren't reaching visitors as expected.
The analytics on this dashboard become available after visitors begin interacting with published experiences on your site. Use the date filter to review personalization performance during a specific period, and the experience filter to focus on a specific experience. The selected period and experience filter apply to all metrics, charts, and experience lists on the dashboard. The metrics available in this dashboard are described below.
To open the Personalization insights dashboard, in the navigation menu, click Optimization. In the left sidebar, click Analytics, then select Personalization insights.
In this dashboard, an experience is a configured personalization experience. A delivery is an individual attempt to deliver content for an experience. Some metrics are visitor-based, while others are delivery-based.
Click Open to see an experience's configuration.
Personalization metrics

Personalization reach
Personalization reach is the percentage of unique visitors that received at least one personalized variant delivery during the selected period.
A high value indicates that personalization is reaching a large portion of your audience. A lower value indicates that fewer visitors are receiving personalized experiences.
To improve personalization reach:
- Review audience conditions configured in your experiences.
- Ensure visitors are meeting the criteria required for personalization.
- Review custom values used in conditions.
Personalized experience rate
The percentage of deliveries that returned a personalized experience during the selected period.
Formula: (personalized deliveries ÷ all deliveries) × 100
Default experience rate
The percentage of deliveries that returned the default experience during the selected period. A default experience delivery is a successful delivery, but it does not count as a personalized experience delivery or contribute to personalization reach.
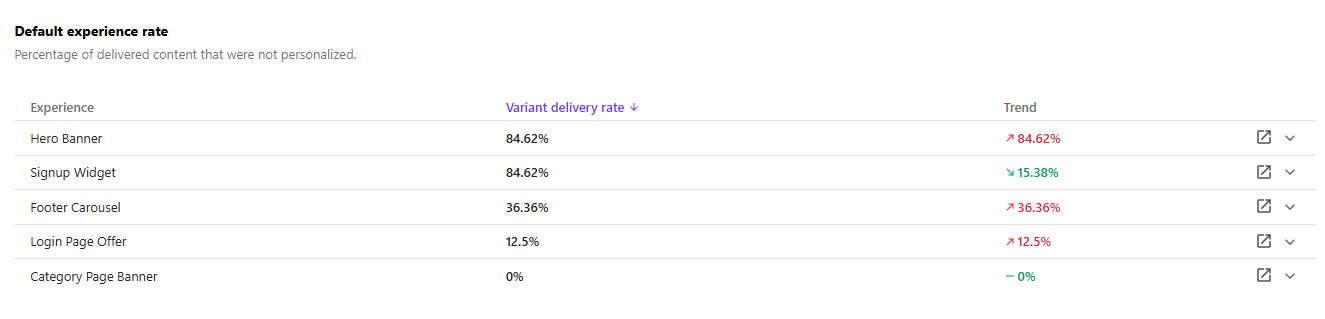
Some default experience deliveries are expected. A consistently high rate can indicate that visitors are not qualifying for personalization, but it can also be expected when an experience targets a deliberately narrow audience.
Formula: (default deliveries ÷ all deliveries) × 100
Zero-reach experiences
The number of experiences that had no personalized deliveries during the selected period.
Click View all to see further details.
Default experiences only
Experiences that were delivered only as default experiences during the selected period.
This can occur when:
- Audience targeting is too restrictive.
- Custom conditions do not match any visitors.
Review your audience targeting, custom conditions, and custom values to ensure they are configured correctly.
Errors
Experiences that returned only errors during the selected period.
Errors can occur when custom conditions or custom values fail during execution. If an experience returns errors:
- Review any custom conditions used by the experience.
- Review any custom values used by the experience.
- Test the condition or custom value to verify that it returns the expected result.
Personalization effectiveness
The Personalization effectiveness report helps you evaluate how your personalization performance changed over time. It shows how your personalized experience rate, default experience rate, and error rate changed over the selected period. Use this to understand how changes to personalization settings affected performance on your site.
Together, the personalized experience rate, default experience rate, and error rate account for 100% of experience deliveries.
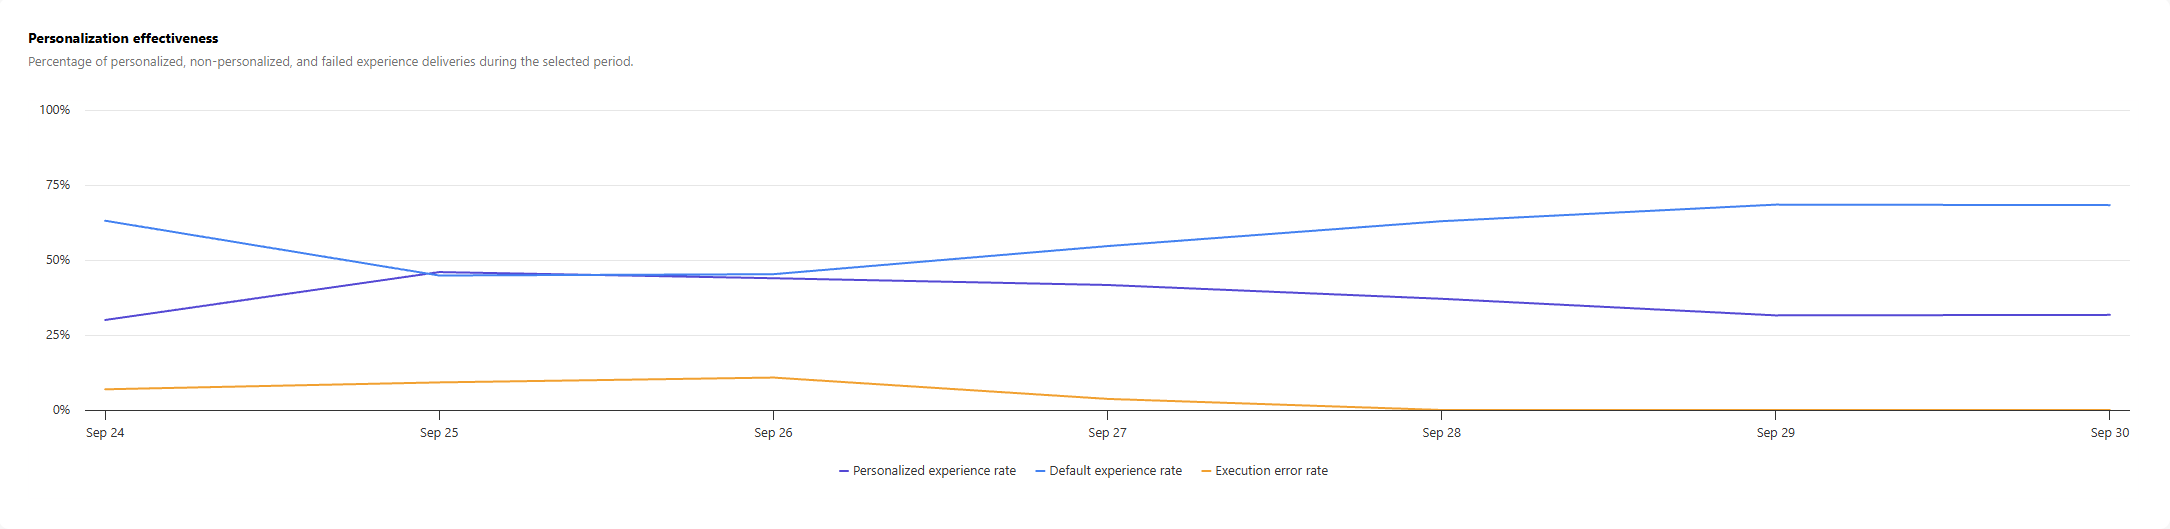
Error rate
Error rate is the percentage of deliveries that had execution errors during the selected period.
Formula: (error deliveries ÷ all deliveries) × 100
Personalized experience rate
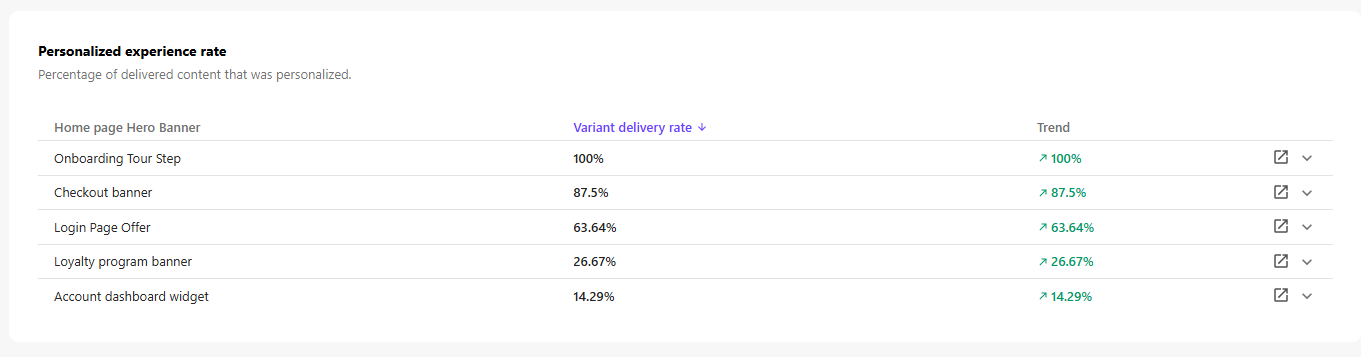
The reports shown in this section depend on the number of experiences across your sites. When there are more than ten experiences, the dashboard displays the Most frequently personalized experiences, Least frequently personalized experiences, and Default experience rate reports. When there are ten or fewer experiences, it displays the Personalized experience rate and Default experience rate reports instead.
When there are ten or fewer experiences across your sites, the personalized experience rate report displays the experiences with the personalized experience rate during the selected period.
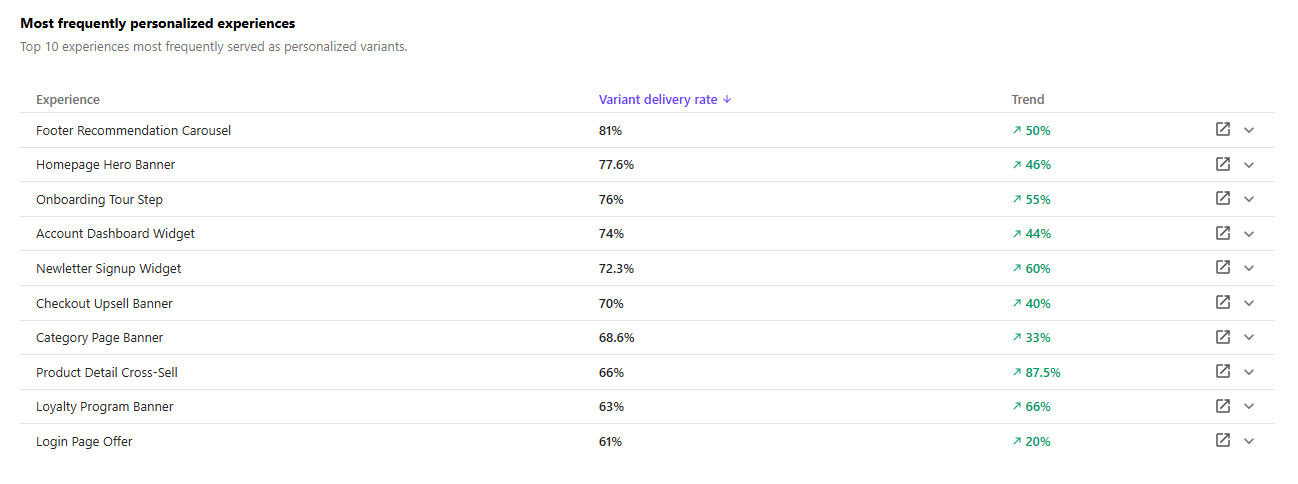
Most frequently personalized experiences
When there are more than ten experiences across your sites, this report shows the top ten experiences with the highest personalized experience rate during the selected period.
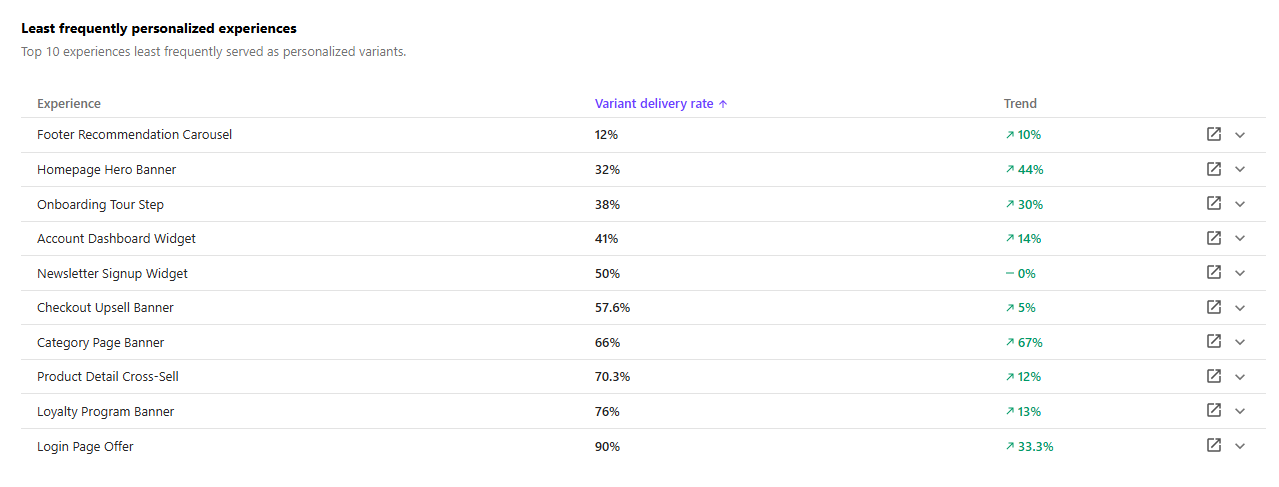
Least frequently personalized experiences
When there are more than ten experiences across your sites, this report shows the top ten experiences with the lowest personalized experience rate during the selected period.
Experiences that appear in this report may benefit from updated audience targeting, variant rules, or additional personalization strategies.
Default experience rate
When there are more than ten experiences across your sites, the default experience rate report displays the ten experiences with the highest default experience rates. When there are ten or fewer experiences across your sites, the report displays all experiences, sorted from highest to lowest default experience rate.
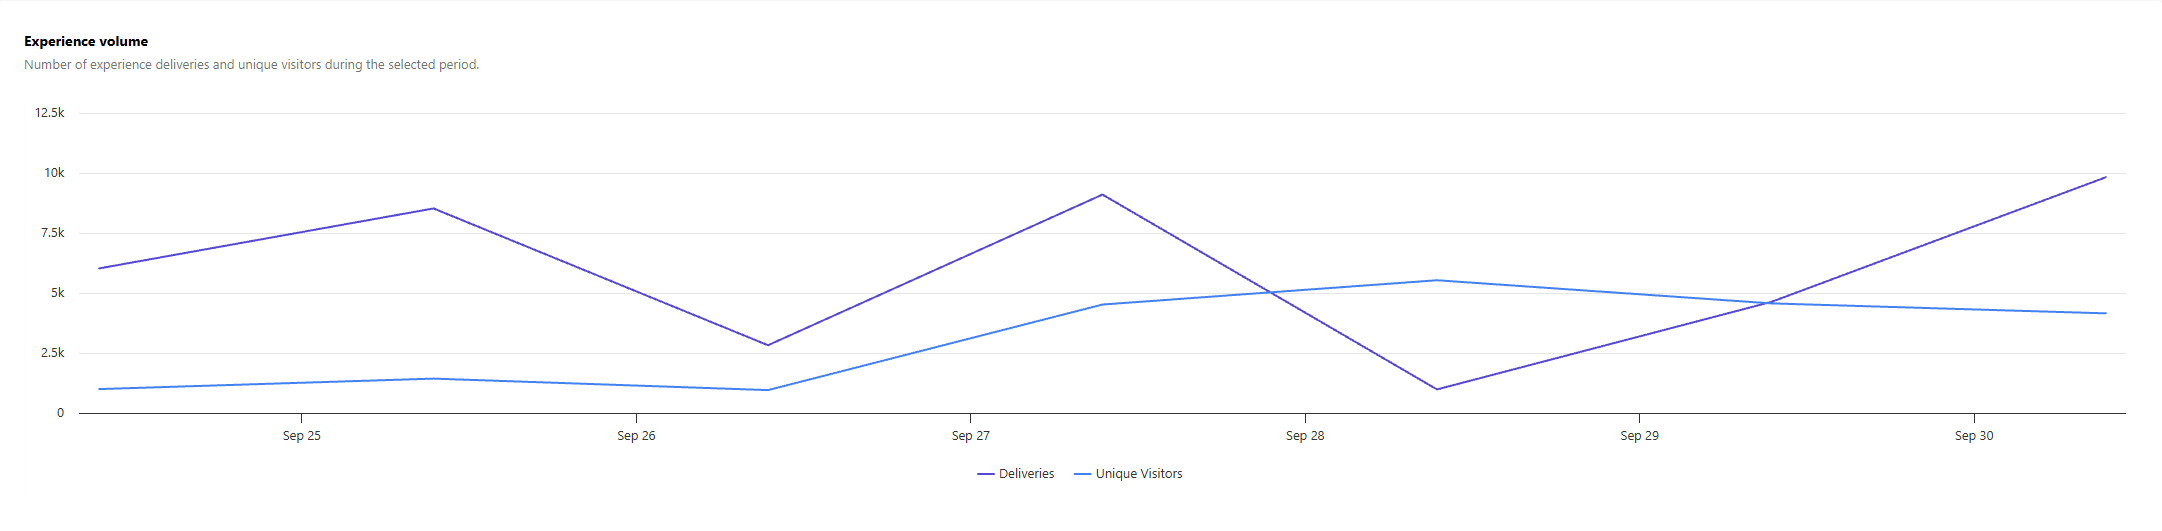
Experience volume
This report shows the number of experience deliveries, including personalized, default, and error deliveries, as well as the number of unique visitors during the selected period.
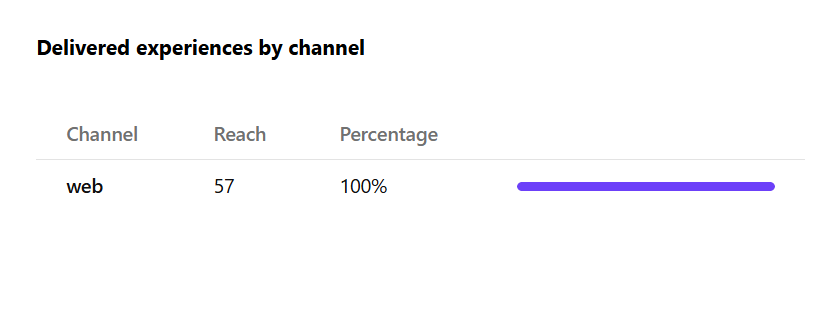
Delivered experiences by channel
Experience deliveries grouped by channel, making it easier to understand where personalization is being delivered and which channels have the highest activity.
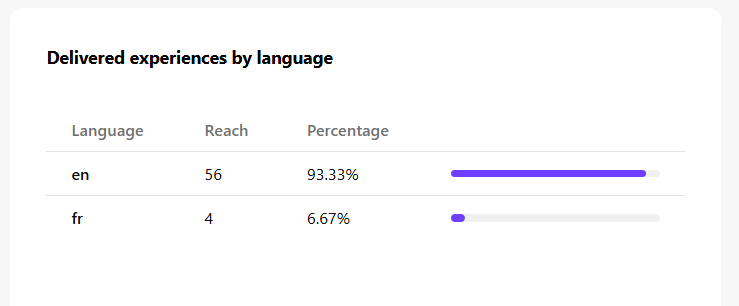
Delivered experiences by language
Experience deliveries grouped by language, making it easier to understand personalization activity across multilingual audiences.
Delivery health
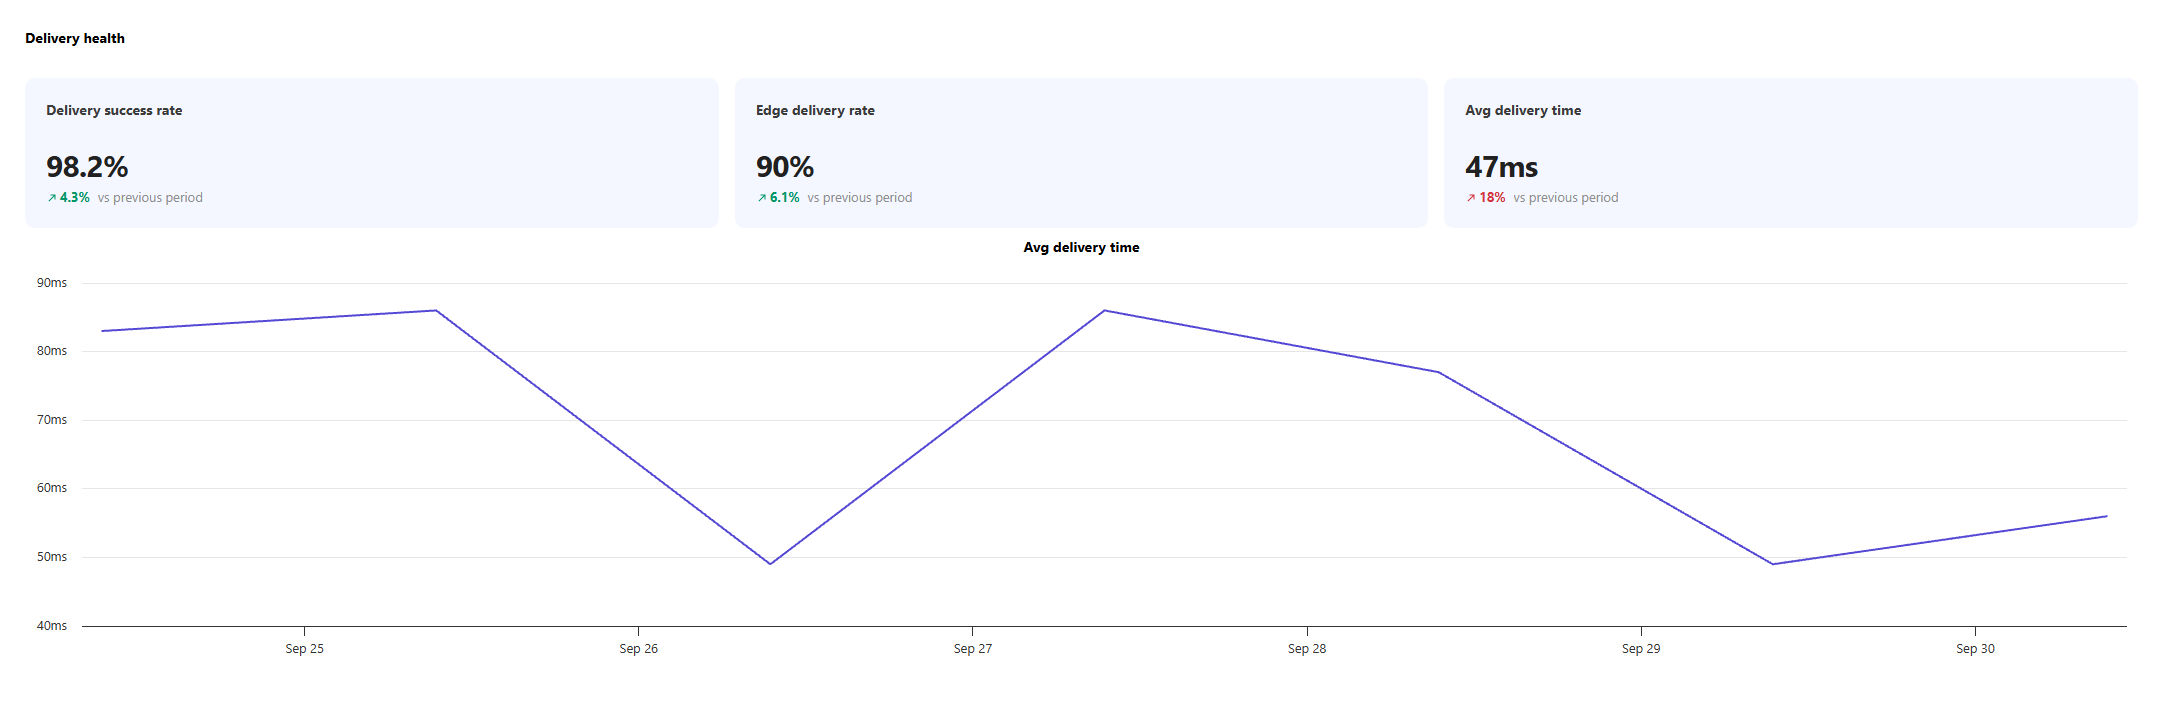
Delivery success rate
The percentage of all experience deliveries that were successful.
Successful deliveries include both personalized experiences and default experience deliveries. Successful deliveries do not include errors.
Edge delivery rate
The percentage of deliveries that were served from Edge.
Average delivery time
The average time, in milliseconds, required to deliver an experience. If average delivery time increases, review experiences that receive the highest traffic and investigate whether changes to personalization configuration correlate with increased delivery times.